Measuring social security’s financial outlook within an aging society

The U.S. Social Security program provides an important ‘first pillar’ of retirement income.1 Policymakers and the media, therefore, pay considerable attention to the financial viability of the program. Each year, the Social Security trustees release a report that summarizes the financial position of the Social Security program. Among other measures, the report draws attention to the program’s ‘crossover date’ (the year the program’s benefit outlays will begin exceeding its tax receipts), the date of ‘trust fund exhaustion,’ and the present value of the program’s financial shortfalls over the next seventy-five years.2
These measures have two problems. First, they create a misleading impression of the program’s financial outlook. Second, they are biased against potential reforms that could improve the program’s finances.
Fortunately, the trustees have recently adopted new accounting measures that deal with both problems. These measures reveal an $11.1 trillion present-value shortfall, which equals about 3.5 percent of the present value of all future taxable payrolls. Unfortunately, because these new measures are buried in the trustees’ report, they have received only scant consideration from policymakers and the media. The newer measures should receive greater attention. Indeed, were these new measures taken more seriously, reforming Social Security and Medicare could reemerge as the top policy priority that it deserves to be.
Social Security covers almost the entire U.S. population, providing participants and their spouses with retirement, disability, and other benefits during different stages of life. Social Security is currently the largest single outlay in the U.S. federal budget; many consider it one of the most successful programs in U.S. history. Although Social Security, on average, replaces only about 40 percent of a worker’s annual earnings before retirement, it provides an important ‘first pillar’ of retirement income. Indeed, for poorer retirees, Social Security replaces 90 percent or more of their previous earnings. Social Security is often credited with reducing poverty among the elderly in the United States.3
Participation in Social Security is mandatory for most occupations.4 Social Security is financed by a 12.4 percent payroll tax on covered earnings up to a limit. This limit is currently $94,200, but it increases each year with the economy-wide average wage. Employer and employee split this tax evenly. Participants become ‘fully insured’ after they have worked in a covered job for forty calendar quarters and earned more than a predetermined wage. Fully insured participants, however, do not acquire a contractual right to specific amounts of benefits.5 Instead, they earn a noncontractual right to benefits that are governed by the laws in effect when they become eligible to receive benefits. These laws as well as the benefit formula are subject to change by Congress.
Social Security’s benefit formula is similar to a private-sector defined-benefit plan’s, where a specific formula applied to a retiree’s wage history determines his or her benefits.6 In contrast, voluntary, tax-favored defined-contribution retirement plans – 401(k), 403(b), Keogh, and others – generate retirement income based directly on a person’s previous contributions and subsequent market investment returns.
Whereas previous contributions ‘fully fund’ withdrawals from voluntary tax-favored retirement plans, Social Security operated mostly on a ‘pay-as-you-go’ basis between the 1940s and the early 1980s: payroll tax revenue collected each year was paid out almost immediately as benefits rather than saved, thereby producing rates of return on previous contributions in excess of the risk-adjusted rates of return that those contributions could have earned in financial markets.7 For those who retired shortly after Social Security began, this financing structure meant that they received more benefits from Social Security in present value than they had paid in payroll taxes. These windfalls occurred each time that Congress expanded Social Security’s coverage and benefits, after 1950 until well into the 1970s.8
Unfortunately, the windfalls awarded to prior generations of retirees do not come for free: future generations must pay for them by receiving lower rates of return on their payroll taxes compared to the rates they could have earned if they had invested their contributions in government bonds instead. In fact, all future generations are worse off.9
During the early 1980s, the independent Office of the Actuary at the Social Security Administration projected that revenues would fall short of benefit outlays during the early part of the twenty-first century, largely because of the baby boom generation’s retirement. Although this generation enlarged the labor force considerably (in part through the greater participation of women in the work-force) and made significant contributions over the past several decades, its members will soon retire, substantially reducing the number of workers available to finance their Social Security and Medicare benefits through payroll and other taxes. As Figure 1 shows, today there are almost five people of working age – between ages 20 and 64 – for each retiree age 65 and older. By 2030, the number of people of working age per retiree will decline to less than three; by 2080, the ratio will fall to about two.
Figure 1
Workers (Ages 20–64) Per Retiree (Age 65 and older)
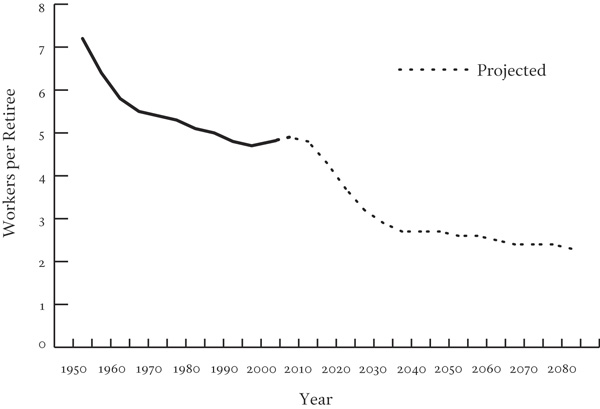
Source: Social Security Administration.
Recognizing these future demographic changes, Congress amended the Social Security Act in 1983 in an attempt to increase the system’s cash flow over the next seventy-five years. Those amendments approved payroll tax hikes, subjected the Social Security benefits of those with other income sources to income taxation, and scheduled a gradual increase in the full retirement age from 65 to 67 beginning in 2003. Since 1983, these changes have generated surpluses in the Social Security trust fund, which currently holds $1.7 trillion in Treasury IOUs.
Despite these reforms, Social Security remains mostly pay-as-you-go in its financing structure. And though $1.7 trillion sounds like a lot, it is insufficient to pay current retirees their scheduled benefits for more than three years. Had the 1983 amendments ‘fully funded’ the Social Security system instead, the trust fund would hold about $13.7 trillion today. Contributions by past and current generations would have been enough to cover their own benefits, and future generations would not have to shoulder any of the burden.
At the time, many thought that the 1983 amendments had resolved Social Security’s financial shortfalls for the subsequent seventy-five years. But soon thereafter projected seventy-five-year imbalances began appearing again.
As shown in Figure 2, payroll tax surpluses will probably continue until 2017 – the so-called crossover date – after which projected benefits will exceed revenues. The trust fund will continue increasing because of interest income accruals through 2027, after which it is projected to decline gradually and be exhausted by 2041. The Social Security trustees estimate that the present value of benefits, scheduled under current law, over the next seventy-five years will exceed by $4 trillion the present value of its payroll tax revenues plus the current value of the trust fund’s Treasury securities.
Figure 2
Social Security’s Revenues and Outlays
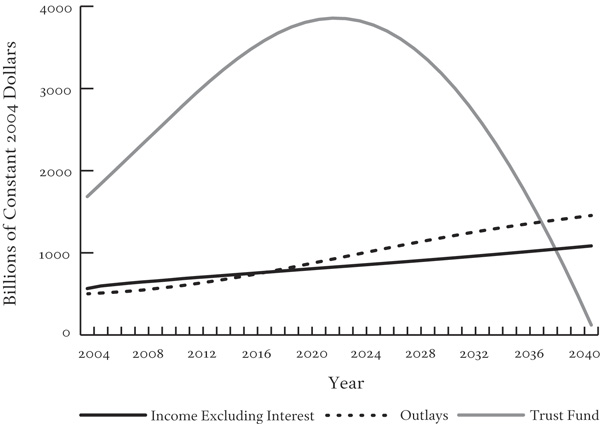
Source: Social Security Administration.
In other words, only if the government immediately deposited an additional $4 trillion into the trust fund, by increasing taxes or reducing spending, would it be able to pay current-law benefits over the next seventy-five years. An infusion of money into the trust fund would also increase public and national saving if it were not reborrowed and spent on other government programs – a topic of recent debate.10 Were the new monies spent entirely on other programs, the government’s overall capacity to pay future Social Security benefits would not improve even though the value of Treasury securities in the trust fund would increase.
The ‘moving window’ phenomenon partially explains why the seventy-five-year imbalances reappeared after 1983. In 1983, the projected seventy-five-year window ended in 2057; today it ends in 2079. Simply moving the seventy-five-year window to cover the years 2058 through 2079 – when cash-flow shortfalls are projected to accrue – created most of the recent $4 trillion imbalance. In other words, because the measures of the system’s solvency used in 1983 were based on a limited time horizon, policymakers back then failed to include the additional adjustments to taxes and benefits necessary to achieve a sustainable Social Security system. Unfortunately, their failure means that we must make even larger adjustments in the future.
The same limited perspective on the system’s financial condition is again hampering reform efforts today. Indeed, the problem of a ‘moving window’ implies that reforms that make the system solvent over the next seventy-five years will just falter again as the window moves forward into the future. As shown in the first panel in Table 1, the 2005 Social Security Trustees Report projects an additional $7.1 trillion imbalance in present value (as of 2004) after the year 2079.
Table 1
Unfunded OASDIa Obligations [present values as of January 1, 2005; dollar amounts in trillions]
| Unfunded obligations through 2079b Unfunded obligations after 2079c Equals total unfunded obligations (open-group obligations) | $4.0 7.1 11.1 |
| Unfunded obligations attributable to past and current participants (closed-group obligations)d Unfunded obligations atributable to future participantese Equals total unfunded obligations (open-group obligations) | 12.0 -0.9 11.1 |
| a ‘Old age, survivors, and disability insurance’ is the official name of Social Security. b Present value of future costs less future taxes through 2079, reduced by the amount of trust fund assets at the beginning of 2005. c Present value of future costs less future taxes after 2079. d This concept is also referred to as the closed-group unfunded obligation. It is equal to the present value of benefits paid to current and past generations less the taxes and the value of the trust fund. e People age 14 and below in 2005. |
Source: 2005 Social Security Trustees Report, Table IV.B6 and IV.B7.
Adding the $7.1 trillion imbalance after the year 2079 to the $4 trillion imbalance projected through 2079 produces a present-value imbalance of $11.1 trillion, which is equal to about 3.5 percent of the present value of all future taxable payroll revenue.11 Barring any reform this year, this $11.1 trillion imbalance will only grow with interest, just like any regular ‘debt rollover.’ Indeed, according to the trustees, this imbalance will increase by about $600 billion over just a single year if we do not take legislative action.12 To be sure, the economy will also expand over time and so this $600 billion figure only tells part of the story. Still, even relative to the present value of all future payrolls, Social Security’s problems will grow worse over time. And when added to Medicare’s shortfalls – about seven times larger than Social Security’s13 – the imbalance grows by almost 2 percent of the present value of all future covered payroll for every five years that we delay fundamental reforms. In other words, for every five years that we do not enact policy reform, we would have to permanently increase taxes by an additional 2 percent of taxable payrolls, or reduce outlays by the same amount. The cost of delaying Social Security reforms is, therefore, enormous.
Whereas solvency typically refers to the government’s ability to pay benefits over the next seventy-five years, sustainability refers to its ability to pay benefits into the indefinite future. A Social Security reform that achieves solvency over a limited horizon, but not sustainability, will soon fail to achieve even solvency as the window moves forward to include future years. However, a sustainable reform will also be solvent. Under Social Security’s current projections, achieving sustainability is harder than achieving solvency: an additional $7.1 trillion in tax and benefit adjustments is necessary to address the shortfalls accruing after 2079.
The government routinely uses an ad-hoc measure of sustainability that asks whether the system satisfies two conditions.14 First, is the Social Security system solvent? That is, can Social Security afford to pay current-law benefits over the next seventy-five years with current-law tax revenues over the next seventy-five years plus the current trust fund value? Second, is the trust fund projected to be increasing in size toward the end of the seventy-five-year window? Social Security is deemed ‘sustainable’ if both conditions are met.
This ad-hoc measure of sustainability assumes that the trust fund will continue to increase in size after the seventy-fifth year. This assumption is often invalid. For example, the recent reform plan by Peter Diamond and Peter Orszag15 appears sustainable under this ad-hoc approach. However, under this plan, we must continue to raise payroll tax rates after the seventy-fifth year in order to pay present-law projected benefits and prevent the trust fund from disappearing. Without raising taxes, we would eventually exhaust the trust fund.16
Conversely, a reform might not appear sustainable under the ad-hoc measure even though it fully eliminates the current $11.1 trillion present-value imbalance. For example, Model 2 of the President’s Commission to Strengthen Social Security17 is not projected to achieve solvency over the first seventy-five years – the first condition for sustainability under the ad-hoc measure – without general revenue transfers from the U.S. Treasury. However, if we maintained its reform measures beyond the seventy-fifth year, Model 2 would more than eliminate the existing $11.1 trillion imbalance even without general revenue transfers. That is, Model 2’s cost savings after the seventy-fifth year would more than offset, in present value, the shortfalls projected during the first seventy-five years.
The traditional ad-hoc measure of sustainability, therefore, has serious shortcomings.18 But the most important weakness of this and other traditional measures of Social Security’s finances is that they introduce a bias in policymaking. In particular, reforms that could reduce Social Security’s $11.1 trillion imbalance – and improve Social Security’s sustainability – often worsen each of the more traditional measures, including the trust fund exhaustion date, the crossover date, and the seventy-five-year imbalance.
Consider the ‘actuarially fair carve out.’ This reform is very similar to the plan President Bush is now advocating, which allows participants to ‘carve out’ some of their payroll taxes and deposit them into a personal account that would later augment their traditional benefit, much like 401(k)s and IRAs.19 Since these participants would be contributing less to the traditional system, their traditional benefit would also be reduced by an ‘actuarially fair’ amount equal to one dollar in present value for each dollar carved out.
This reform would have no impact on the $11.1 trillion imbalance. Each dollar that the government loses in payroll contributions would be fully offset by a dollar that the government saves in present value of future benefit payments. Furthermore, unless capital markets responded in an uninformed manner (discussed in more detail later), this reform would not affect wages, interest rates, or gross domestic product (GDP) in any year. Neither would this reform change the net lifetime resources available to any household born at any time. In economic terms, this reform would be fully neutral.
Still, under this reform, all three measures traditionally used to judge Social Security’s viability – the trust fund exhaustion date, the crossover date when costs exceed income, and the seventy-five-year imbalance – would worsen. We would exhaust the trust fund earlier because of the short-run decline in payroll contributions; similarly, the crossover date would occur sooner. The seventy-five-year imbalance would also appear larger because much of the lost tax revenue would show up inside the seventy-five-year window while a larger portion of the future reduction in benefits would fall beyond the seventy-five-year window.
Now let’s modify the example to consider a ‘carve out with a haircut.’ Under this approach, we would reduce a participant’s traditional Social Security benefit by more than a dollar, say $1.10, for every dollar carved out and deposited into a personal account. A worker might be willing to take this ‘haircut’ on future benefits in order to obtain greater ownership and control over his or her retirement resources.
In this case, we would reduce the $11.1 trillion imbalance since the government saves more on benefit payments in present value than it loses in contributions. Still, if policymakers focused only on the traditional measures of Social Security’s finances to judge this reform plan,20 they might reject it even though it would improve Social Security’s financial outlook. The improvement in Social Security’s financial outlook – as reflected by its reduced present value of unfunded obligations – should exert salutary effects on the economy immediately. In particular, private agents’ economic decisions would no longer be distorted by the expectation of higher future costs of resolving Social Security’s financial problems.
Thus, the traditional measures are not very revealing of the program’s true financial status, and worse, they are biased against reforms that could reduce Social Security’s $11.1 trillion imbalance. Unfortunately, these measures often influence the design of reform plans. For example, in Model 2 of the President’s 2001 Commission to Strengthen Social Security, participants are allowed to carve out 4 percent of payroll, up to a maximum of $1,000 per year (wage indexed over time).21 The Commission imposed the $1,000 ceiling to prevent the Social Security system from ‘losing’ too much money over the projected seventy-five-year horizon. Restricted to that horizon, the Commission did not take into account the large cost savings that would begin accruing after the seventy-fifth year. If participants were allowed to make even higher contributions to their personal accounts, Model 2 would more easily eliminate the entire $11.1 trillion imbalance.
Beginning with the 2003 Social Security Trustees Report and the 2004Medicare Report, two new measures have emerged that provide greater insight into the financial status of both programs. The Social Security Advisory Board’s Technical Panel on Assumptions and Methods, which is composed of leading economists and actuaries outside of the Social Security Administration, have also recently endorsed these new measures.22 Indeed, these measures correspond to the way that economists have thought about Social Security’s finances for many years.23
The first measure is sometimes called the ‘open-group unfunded obligation.’ It is the sum of benefits that all past, present, and future generations, or ‘groups,’ have received (and are projected to receive) in present value less the amount of taxes they have paid (and are projected to pay). We can also calculate it as the present value of all projected Social Security benefits minus the present value of all projected payroll taxes and the current value of the trust fund.
The open-group unfunded obligation reveals the extent to which the current Social Security program is unsustainable. That is, it shows Social Security’s financial imbalance arising from all generations. Table 1 shows that based on calculations provided by the independent Office of the Actuary at the Social Security Administration, the trustees estimate the open-group obligations at $11.1 trillion in present value. In other words, in order to make Social Security sustainable, we must reduce scheduled benefits and/or increase taxes so that the sum of cost savings and new revenues total $11.1 trillion in present value.
The second measure is sometimes called the ‘closed-group unfunded obligation.’ It shows the amount of Social Security’s $11.1 trillion imbalance arising from providing benefits to past and present generations (those age 15 and older up to those who are deceased as of 2005) in excess of their payroll taxes in present value. Unlike the open-group obligation, this calculation is ‘closed’ to, or does not include, future generations.
Based on calculations provided again by the Office of the Actuary, the trustees estimate that past and current generations will receive about $12 trillion more in benefits in present value than they will pay in taxes (see Table 1). In contrast, future generations (those age 14 and younger in 2005 as well as the unborn) are projected to receive $0.9 trillion less in benefits than they will pay in taxes (see Table 1). The ‘overpayment’ by future generations, though, is still not enough to pay for the ‘overhang’ of $12 trillion they are projected to inherit from past and current generations under current law. Either future generations will have to pay an additional $11.1 trillion in present value or generations alive to-day will have to make this sacrifice, or a combination of both.
The open-group and closed-group measures are robust to the criticisms that apply to traditional measures of Social Security’s finances. For example, both measures correctly identify the economic as well as intergenerational neutralities of the ‘actuarially fair carve out’ discussed earlier. In the case of a ‘carve out with a haircut,’ the open-group and closed-group measures both improve (they are both smaller), corresponding to a move toward sustainability and smaller burdens on future generations. In contrast, the traditional measures such as the trust fund exhaustion date and crossover date incorrectly show a deterioration of Social Security’s finances in both instances.
Although the usefulness of the closed-group measure in determining sustainability is not as widely understood as the open-group measure’s, the closed-group measure is vital to comprehending Social Security’s impact on the economy. Some believe that the closed-group measure is mostly meaningful in the context of a ‘fully funded’ system.24 Under such a system, each generation would pay for its own benefits, and so the closed-group obligation would be zero.
But the closed-group measure is a very important statistic even in a pay-as-you-go system for two key reasons. First, it indicates the extent to which any reform will reshuffle fiscal burdens across generations. For example, suppose Social Security benefits were increased and this increase were financed on a strict pay-as-you-go basis by raising payroll taxes. This policy change would not have any impact on the open-group measure or the traditional measures. But the closed-group measure would grow larger because this reform would transfer wealth from future generations to current generations. Current generations would gain from this policy change since they would receive more in benefits in present value than they paid in taxes; indeed, current retirees would receive additional benefits for free. But future generations would pay for this windfall by receiving a benefit less valuable than the additional taxes they paid in present value. The closed-group measure, which shows the net gain to past and current generations, would become larger, thereby clearly indicating the extent of this intergenerational transfer.
Second, the closed-group measure reveals how much pay-as-you-go financing may ‘crowd out’ private saving and, hence, increase interest rates, lower wages, and reduce the nation’s GDP.25 Consider again a pay-as-you-go financed increase in benefits. Because this reform transfers resources from future to current generations, it reduces the amount of money today’s generations must save for their own retirement. This reform, therefore, could permanently reduce the economy’s level of capital.26
The Congressional Budget Office estimates that every dollar transferred from future to current generations reduces private savings by zero to fifty cents.27 Although the wide range of this estimate suggests considerable uncertainty, it follows that Social Security may have reduced the U.S. capital stock by as much as $6 trillion and reduced gdp by as much as $1.1 trillion.28 Nonetheless, the traditional measures as well as the open-group measure do not indicate these large macroeconomic effects. Presumably, any discussion of Social Security reform would want to take into account the impact of a reform on the economy. Although Social Security has had many successes, its potentially large deleterious effect on capital stock and national output deserves more attention in the debate over Social Security reform.
Because the open-group measure extends the traditional seventy-five-year imbalance measure beyond the seventy-fifth year, one might at first be tempted to argue that the open-group measure places too much emphasis on Social Security’s long-run finances. In other words, one could imagine a hypothetical ‘reform’ that does nothing to fix Social Security’s finances during the first seventy-five years but enacts large reforms after the seventy-fifth year in order to eliminate Social Security’s $11.1 trillion imbalance.
This potential criticism, however, is misplaced since it forgets that the $11.1 trillion open-group obligation is in terms of present value. Besides adjusting for inflation, the present-value calculation adjusts for the real interest costs that we save from paying obligations sooner rather than later. For example, increasing payroll taxes by one dollar today would reduce the open-group obligation by, of course, one dollar. But if we postponed this one-dollar tax increase (still measured in 2004 inflation-adjusted dollars) in one hundred years we would reduce the $11.1 trillion open-group obligation by only 4.7 cents in today’s dollars.29 Delaying the one-dollar tax increase 150 years would reduce the unfunded obligations by only one cent. Attempting to postpone reforms would just mean enacting unrealistically large reforms later on.
The closed-group obligation measure reflects the amount of projected overspending on past and current generations. Thus, a policy that lets current generations ‘off the hook’ produces a larger closed-group obligation than a reform that requires current generations to bear more of the costs. Rather than drawing ‘too much’ attention to the long run, the open-group and closed-group obligation measures remove the biases, embedded in the traditional measures, against reforms that could improve Social Security’s long-run financial outlook. These newer measures focus attention on the true magnitude of the reforms needed to place Social Security on a sustainable path and, hence, reveal the urgent need for action. Social Security’s $11.1 trillion open-group unfunded obligation is almost three times as large as the amount the seventy-five-year imbalance measure indicates, despite the fact that the present-value calculation considerably reduces the weight placed on shortfalls that accrue after the seventy-fifth year.
Robert Myers, who was chief actuary of the Social Security Administration from 1947 to 1979, points out that before 1965 Social Security actuaries routinely relied on measures looking beyond seventy-five years. In 1965, however, Social Security’s actuaries and policymakers began focusing on seventy-five-year shortfalls because then, unlike today, extending the financial projections beyond seventy-five years made very little difference to the program’s financial outlook. However, Mr. Myers always thought that truncating measures at seventy-five years was never right in theory because of the moving-window problem: “I’m still an ‘infinity’ guy, because even if you have a seventy-five-year period, every year you do a new valuation you have some slippage.”30 This slippage is especially acute today, with over two-thirds of the $11.1 trillion shortfall lying outside of the seventy-five-year window.
Critics also charge that present-value estimates beyond seventy-five years are sensitive to underlying demographic and economic assumptions.31 Of course, uncertainty should only enhance the desire to seek remedies rather than to ignore the expected problem.32
Furthermore, different interest rate and productivity assumptions and different demographic projections do not greatly affect the size of the policy changes – either tax increases or benefit cuts – needed to reduce Social Security’s imbalance.33 Although changes in these underlying assumptions will alter the present value of the imbalance, the present value of Social Security’s tax base and future benefits also move almost proportionally and in the same direction. As a result, the increases in tax rates or cuts in benefit rates required to eliminate Social Security’s current fiscal imbalance exhibit much smaller sensitivity to parametric changes in economic and demographic assumptions.
President Bush’s plan for personal accounts would create additional government debt while simultaneously reducing Social Security’s unfunded future outlays. Government debt would increase as households could divert some of their payroll taxes to their personal accounts, thereby reducing government revenue. Future Social Security outlays would also decline however, under the President’s actuarially fair carve out because the government could reduce benefit payments by one dollar in present value for each dollar placed into a personal account.
From an economic perspective, one dollar of government debt is not very different than one dollar of federal unfunded obligations. Both represent a dollar the government owes. Hence, real interest rates should not rise in response to the President’s plan because investors should be indifferent between the two under reasonable circumstances.34
Legally, however, debt held by the public is a legal liability that the government must honor unless it declares bankruptcy.35 Social Security and Medicare benefits, on the other hand, are only obligations of the government, which an act of Congress can alter. In practice, therefore, capital market participants may be discounting future Social Security benefits at a higher rate than the yield on Treasury securities because the capital market participants think that the government might pay only a portion of its present-law Social Security obligations in the future. Replacing a dollar in present value of future Social Security benefits with a dollar of explicit debt, therefore, could negatively affect how investors perceive the outlook of the federal government’s finances.
However, the government is not necessarily more likely to pay explicit debt liabilities in real terms than Social Security obligations. Indeed, the opposite is also conceivable: most explicit debt is not protected against inflation. So faster inflation compounded over time could easily erode the value of the government’s payments to bondholders. In contrast, the Social Security benefits of retirees and others, once determined, are fully protected against inflation, and will likely remain so well into the future. Moreover, even if policymakers believed that market participants discount future Social Security benefits by, say, 10 percent above the government’s discount rate then policymakers could offer a ‘carve out with a 10 percent haircut’ to avoid disrupting capital markets.
The Social Security program provides an important source of income for most of the nation’s retirees, but the program’s long-term viability is in serious doubt unless a fundamental reform is undertaken – either by increasing taxes or by reducing the growth rate of benefits. Unfortunately, the traditional accounting measures used by policymakers and the media convey very little about the true magnitude of the financial problem facing Social Security. Those measures are also biased against reforms that could reduce Social Security’s imbalance.
Fortunately, the Social Security trustees have begun to include new measures of Social Security’s financial outlook, beginning with their 2003 report and continuing with the 2004 and 2005 reports – measures that fully convey the dimensions of Social Security’s financial hole. The independent panel of experts appointed by the Social Security Advisory Board has endorsed these measures but, unfortunately, policymakers and the media are not paying sufficient attention to these new measures. We argue that these measures deserve much more careful consideration.
ENDNOTES
4 A notable exception includes state workers who are covered by state pension programs.
5 See the U.S. Supreme Court case, Nestor v. Flemming, 363 U.S. 603 (1960).
7 Dean R. Liemer, “Cohort-Specific Measures of Lifetime Net Social Security Transfers,” Social Security Administration, Office of Research and Statistics, Working Paper No. 59, February 1994.
12 Social Security Trustees, 2005 Social Security Report, Section IV.B.5.a.
17 President’s Commission to Strengthen Social Security, Strengthening Social Security, 68–71.
22 See “The 2003 Technical Panel on Assumptions and Methods Report” http://www.ssab.gov/NEW/documents/2003TechnicalPanelRept.pdf.
30 Robert Myers, “Oral History Overview,” 1995,http://www.ssa.gov/history/myersorl.html (accessed September 28, 2005).
32 This fact holds under any standard preference toward risk that shows a prudence motive.
33 Gokhale and Smetters, Fiscal and Generational Imbalances.