The Humanities Indicators project recently released a series of reports on the life cycle of doctoral degree recipients in every field, shedding light on the challenges involved in earning the degree, and the occupational outcomes and incomes of those with a Ph.D.
The Costs of a Ph.D.
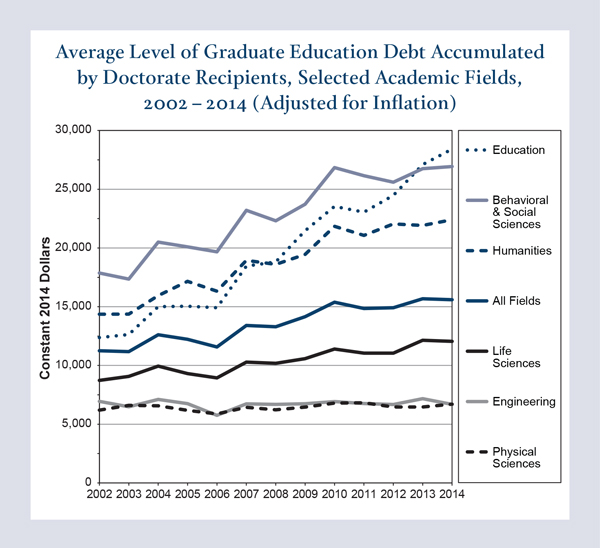
In a new analysis of the costs of earning a Ph.D., the Indicators report that debt accumulated during graduate study among recent degree recipients has been rising faster than inflation.1 From 2002 to 2014, for example, the median level of graduate education debt of doctoral degree recipients increased 39 percent, from $11,252 to $15,591 in inflation-adjusted dollars (Figure 1).
Figure 1 |
 |
| Source and details at http://humanitiesindicators.org. |
Debt levels rose most sharply for doctoral degree recipients in education (an increase of 130 percent) and in the humanities (an increase of 56 percent), as well as in the behavioral and social sciences (an increase of 51 percent). As of 2014, median debt levels for students in all three fields were well above the median for all fields combined – ranging from $22,405 among humanities Ph.D.’s to $28,412 for doctoral degree recipients in education.
In a separate analysis, the Indicators report that these same three fields also have the largest shares of graduates that relied primarily on their own resources to pay for their studies: 48 percent of the 2014 Ph.D.’s in education, 25 percent of the graduates in the behavioral and social sciences, and 20 percent among new degree recipients in the humanities.2
Ph.D.’s in the humanities were also notable for having the highest reliance on teaching assistantships: 41 percent reported that teaching assistantships were their primary source of support. In comparison, among doctoral degree recipients in the life and physical sciences, less than 28 percent reported a strong reliance on teaching assistantships, but more than 33 percent in each field reported research assistantships as their primary source of support.
Another important cost for those pursuing a Ph.D. is time spent earning the degree. The Indicators highlight variation among the fields: the median number of years humanities doctoral degree recipients spend in their programs is one year longer than Ph.D.’s in the science fields.3 In a new analysis, the Indicators find that the median age of doctoral degree recipients in the humanities has consistently been three-years older than the median for all fields combined. In 2014, the median age of new humanities Ph.D.’s was 34.2 years; among doctoral degree recipients in engineering and the life and physical sciences, the median age was 31 years or less.4
A Mix of Occupations for Ph.D.’s
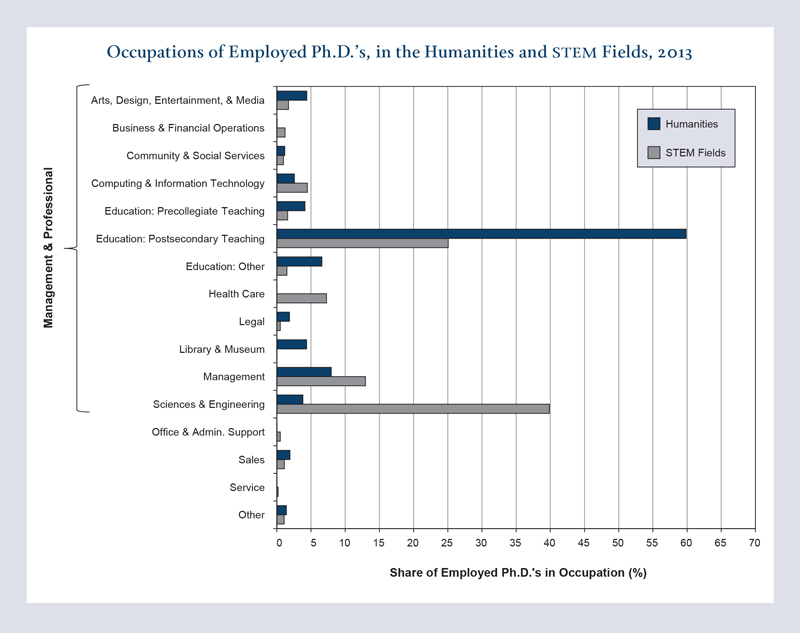
Alongside the new insights into the challenges involved in earning a doctoral degree, the Indicators released cross-field comparisons of the occupations of Ph.D.’s. An original analysis of data from the National Science Foundation’s National Survey of College Graduates (NSCG) highlights the wide differences among the fields in the occupational outcomes of their graduates (Figure 2).5
Figure 2 |
 |
| Source and details at http://humanitiesindicators.org. |
As of 2013, 60 percent of employed humanities Ph.D.’s were in postsecondary teaching jobs, as compared with less than a third of the doctoral degree recipients from each of the STEM fields. Only Ph.D.’s from the fine and performing arts had a comparable share employed in postsecondary teaching (55 percent).
The new findings highlight the much larger array of applied and practical occupational positions available for doctoral degree recipients from the STEM fields, with substantial shares employed in science and engineering jobs rather than in postsecondary teaching positions – ranging from 36 percent of employed Ph.D.’s in the behavioral and social sciences to 49 percent of the doctoral degree recipients in the life sciences.
Beyond the large gaps among the fields in the shares employed in postsecondary teaching, as opposed to science and engineering occupations, substantial shares of Ph.D.’s from most fields were in management positions – from 8 percent of humanities and health and medical sciences Ph.D.’s to 19 percent of those who received doctoral degrees in business. The one exception was among arts Ph.D.’s: less than 3 percent of doctoral degree recipients in the arts were employed in management positions.
Earnings for Ph.D. Recipients
The field with the highest concentration of Ph.D.’s in academic employment – the humanities – also had the lowest median earnings, according to the Indicators. Humanities Ph.D.’s working full time had a median salary of $75,000, well below the median for all fields combined ($99,000)6.
Some humanities Ph.D.’s made considerably more, however. Earnings for the top 25 percent of doctoral degree recipients in the humanities were greater than the median earnings of Ph.D.’s in each of the other fields.
The report also notes that there was a substantial gender earnings gap among doctoral degree recipients in every field except education. Ph.D.’s from business and the humanities had the largest gender gap among employed Ph.D.’s – with a 34 percent gap in median annual earnings between men and women employed full time (the median earnings for men were $95,000 compared with $63,000 for women). Among the STEM fields, the gap was 30 percent in the life sciences (the median earnings for men were $100,000 compared with $70,000 for women), and even smaller in the other STEM fields.
Prompted by the interest generated by these reports, the Indicators staff is using the NSCG data to answer additional questions, such as how levels of earnings and job satisfaction for those employed in postsecondary teaching compare to that of advanced degree recipients who are employed outside the professoriate.
ENDNOTES
1. See http://humanitiesindicators.org/content/indicatordoc.aspx?i=11125. Data drawn from federal Survey of Earned Doctorates.
2. See http://humanitiesindicators.org/content/indicatorDoc.aspx?i=50. Data drawn from federal Survey of Earned Doctorates.
3. See http://humanitiesindicators.org/content/indicatorDoc.aspx?i=49.
Data drawn from federal Survey of Earned Doctorates.
4. See http://humanitiesindicators.org/content/indicatordoc.aspx?i=11126. Data drawn from federal Survey of Earned Doctorates.
5. See http://humanitiesindicators.org/content/indicatordoc.aspx?i=69. Data drawn from National Science Foundation, National Survey of College Graduates, 2013.
6. See http://humanitiesindicators.org/content/indicatordoc.aspx?i=70. Data drawn from National Science Foundation, National Survey of College Graduates, 2013.