Control Costs and Increase Affordability
Introduction
As the first two sections of this report make clear, the Commission believes the future prosperity and well-being of American society depend upon a substantial majority of citizens completing a postsecondary education of quality in the decades ahead. Pursuing this goal implies that, no matter how high the quality of an undergraduate education in the United States, it cannot serve its purpose if it is not financially accessible to all who can benefit.
In the United States, the responsibility for providing the resources through which colleges and universities pay the costs of providing undergraduate education is shared among four principal groups of actors:
- Students themselves and their families, who pay tuition, room and board, and other college expenses partly out of pocket from current income, partly out of savings, and partly out of future income, through borrowing;
- State and local governments, which draw on appropriated funds to provide public institutions with some of the money they need to pay their bills and which in some states provide money directly to students in the form of student aid to help pay tuition and other expenses;
- The federal government, which provides Pell Grants, GI Bill funds, and other grant aid to students to help pay their college expenses, as well as making tax credits and deductions available to qualifying families to help defray the costs of college. The federal government also relies on its unique access to capital to provide the bulk of the lending that helps families spread college payments over time; and
- Businesses, philanthropic organizations, and individual donors, who help defray college costs through a combination of funding student scholarships and making direct gifts and grants to colleges and universities to help defray college expenses.
The affordability of college for students and families thus depends on successful coordination of the efforts of all of these sets of actors, so that students and their families do not have to carry unreasonable burdens to attend college, and also so that in an environment of scarcity students and families are not provided with public or philanthropic resources beyond what is needed to make college possible for them. The share of resources supplied by these various actors and its variation over time is shown in Tables 1A, 1B, 1C, and 1D. The tables show that the share of resources supplied by students and their families has grown significantly, while the share provided by state and local governments has declined. (The one exception to this is for those students who attend community colleges.) This familiar story of growing reliance on families to pay for their own education, with less assistance from state governments, is a major source of concern. The tables also show that students and families make part of their contribution in cash, drawn from a combination of savings and current income, with the rest of their contribution financed by borrowing, principally from the federal government. The existence of federal lending has assisted students and families in coming up with the money to pay college bills, but it has also resulted in rising student indebtedness and thus contributed to worries about affordability.
Tables 1A, 1B, 1C, and 1D present data on how “the average student” attending different types of colleges (public, private, for-profit; two-year and four-year) pay for college (often with help from their family). Although the “average” is a statistical construct that masks a great deal of important variation, these calculations can help explain what the financial flows involved in college enrollment are like. The student’s actual tuition price is determined by deducting from the average “sticker price” (tuition and fees) at a particular college type their grants from various sources, as well as tax benefits. Typical room and board charges for a full-time student at that type of institution are then added to get an approximate view of how much money the family has to come up (Net Tuition Fees and Room and Board or Net TFRB). This is the student’s “bottom line.” The tables then show how students and families, on average, split that charge between cash and education loans, which the student—or for parent loans, the parent—is obliged to repay.
TABLE 1A: How “Average” Students Pay for College at Public Four-Year Institutions
| PUBLIC FOUR-YEAR | 2007–2008 | 2011–2012 | 2015–2016 |
| Tuition and Fees | $7,090 | $8,740 | $9,420 |
| Grants and Tax Benefits | |||
| Pell Grants | $970 | $1,690 | $1,430 |
| State Grants | $930 | $970 | $1,080 |
| Employer and Private Grants | $460 | $580 | $690 |
| Institutional Grants | $1,330 | $1,330 | $1,610 |
| Tax Benefits | $370 | $1,100 | $1,010 |
| Total Grants and Tax Benefits | $4,060 | $5,670 | $5,830 |
| NET TUITION AND FEES | $3,030 | $3,070 | $3,590 |
| Room and Board | $8,440 | $9,380 | $10,150 |
| NET TUITION, FEES, ROOM AND BOARD | $11,470 | $12,450 | $13,730 |
| How Average Students Pay | |||
| In Cash | $7,590 | $8,200 | $9,800 |
| Educational Borrowing | $3,880 | $4,250 | $3,940 |
TABLE 1B: How “Average” Students Pay for College at Private Four-Year Institutions
| PRIVATE FOUR-YEAR | 2007–2008 | 2011–2012 | 2015–2016 |
| Tuition and Fees | $26,830 | $29,460 | $32,330 |
| Grants and Tax Benefits | |||
| Pell Grants | $1,010 | $1,610 | $1,370 |
| State Grants | $1,050 | $920 | $950 |
| Employer and Private Grants | $940 | $1,690 | $1,940 |
| Institutional Grants | $8,300 | $11,250 | $13,650 |
| Tax Benefits | $570 | $1,320 | $1,210 |
| Total Grants and Tax Benefits | $11,880 | $16,790 | $19,130 |
| NET TUITION AND FEES | $14,960 | $12,660 | $13,200 |
| Room and Board | $9,820 | $10,660 | $11,540 |
| NET TUITION, FEES, ROOM AND BOARD | $24,780 | $23,320 | $24,740 |
| How Average Students Pay | |||
| In Cash | $17,410 | $16,410 | $18,210 |
| Educational Borrowing | $7,370 | $6,910 | $6,530 |
TABLE 1C: How “Average” Students Pay for College at Public Two-Year Institutions
| PUBLIC TWO-YEAR | 2007–2008 | 2011–2012 | 2015–2016 |
| Tuition and Fees | $2,630 | $3,140 | $3,440 |
| Grants and Tax Benefits | |||
| Pell Grants | $1,200 | $2,520 | $2,290 |
| State Grants | $370 | $370 | $430 |
| Employer and Private Grants | $190 | $310 | $420 |
| Institutional Grants | $200 | $280 | $420 |
| Tax Benefits | $290 | $430 | $430 |
| Total Grants and Tax Benefits | $2,260 | $3,910 | $3,990 |
| NET TUITION AND FEES | $370 | -$770 | -$550 |
| Room and Board | $7,920 | $7,750 | $7,930 |
| NET TUITION, FEES, ROOM AND BOARD | $8,290 | $6,970 | $7,380 |
| How Average Students Pay | |||
| In Cash | $7,640 | $6,120 | $6,860 |
| Educational Borrowing | $650 | $850 | $520 |
TABLE 1D: How “Average” Students Pay for College at For-Profit Institutions
| FOR-PROFIT | 2007–2008 | 2011–2012 | 2015–2016 |
| Tuition and Fees | – | $16,900 | $15,130 |
| Grants and Tax Benefits | |||
| Pell Grants | $3,060 | $4,600 | $4,840 |
| State Grants | $800 | $550 | $830 |
| Employer and Private Grants | $860 | $1,770 | $2,160 |
| Institutional Grants | $300 | $160 | $270 |
| Tax Benefits | $980 | $1,860 | $2,160 |
| Total Grants and Tax Benefits | $6,390 | $7,800 | $8,500 |
| NET TUITION AND FEES | – | $9,090 | $6,630 |
| Room and Board | $7,920 | $7,750 | $7,930 |
| NET TUITION, FEES, ROOM AND BOARD | – | $16,840 | $14,560 |
| How Average Students Pay | |||
| In Cash | – | $9,840 | $9,420 |
| Educational Borrowing | $8,240 | $7,000 | $5,140 |
Sources (Tables 1A, 1B, 1C, and 1D): Sandy Baum, Jennifer Ma, Matea Pender, and Meredith Welch, Trends in Student Aid 2016, The College Board, 2016; Jennifer Ma, Sandy Baum, Matea Pender, and Meredith Welch, Trends in College Pricing 2016, The College Board, 2016.
This more complete picture of student finance offers many insights and a few surprises. Private four-year colleges, for example, offer a large discount to the average student—greater than $13,000 in 2015–2016—and the discount has gone up fast enough that the average student there pays less in tuition now than did their counterpart in 2007–2008. But room and board charges have risen fast enough to leave the family’s bottom line essentially unchanged. The growth in discounting at public four-year and two-year colleges is also striking, although in this case it is led by the very large expansion in the Pell Grant program during the recession, more than doubling at two-year and nearly doubling at four-year institutions. These increases have been largely sustained but not further increased as the recession has receded. Despite the increase since 2007–2008 in federal grants, growth in the sticker price and in room and board charges has been rapid enough to result in an increase of more than $2,000 in the amount students must pay on average. It is noteworthy that students and parents have met this increased charge not by higher borrowing (the average amount borrowed has actually fallen at four-year publics) but by greater payments in cash, perhaps explained in part by the postrecession recovery of housing and financial asset values.
This brief review of the numbers is a reminder that the problems involved in financing such a complex, multidimensional operation as modern undergraduate education are unlikely to yield to simple solutions. For richer, more detailed information on much of this, see A Primer on the College Student Journey, published earlier by the Commission.79 The information provided below limits the data to full-time students and masks the huge variation among students and institutions by reporting on averages.
These are the major actors providing the resources that cover the cost of providing undergraduate education. Note, however, that it is the colleges themselves that combine these resources to actually produce education (in concert with students). Thus, the effectiveness and efficiency of higher education institutions in managing these resources helps determine both the size of the total bill the nation pays in providing undergraduate education and the numbers of students successfully completing college. Colleges and universities are key actors in determining how affordable colleges and universities will be not only for students and families but for the society as a whole. While the political forces that shape governmental finance are never easy to predict, few observers anticipate that either the federal, state, or local governments will move sharply in the direction of more generous funding for undergraduate education in the foreseeable future, so the Commission anticipates that the demands on postsecondary institutions to deliver high-quality education for less money will continue to be strong.80
The next section begins a discussion of the role of the federal government in providing grant and loan aid to students and ways these systems can be made to work better for families; the challenges state governments face in fulfilling their financing and operating roles as the principal suppliers of higher education to our students; the role of colleges and universities themselves, both in managing their costs and in communicating transparently with students and families about the share of the costs they will be expected to cover; and, briefly, federal, state, and accreditor regulatory matters.
The Federal Role
The federal government funds undergraduate students primarily through the federal financial aid system. Rather than providing subsidies directly to institutions, the government operates grant, loan, and work-study programs that allocate funds to students. It also offers tax credits and deductions to parents and students who pay tuition. Nonloan federal student aid for undergraduate students rose from $12 billion (in 2016 dollars) in 1996–1997 to $28 billion in 2006–2007 and to $56 billion in 2016–2017. Over the same period, annual federal loans to undergraduate students and their parents rose from $31 billion to $47 billion to $58 billion.
This investment in undergraduate students could be more effective if federal aid programs were simpler, better targeted, and more flexible. There are strong arguments in support of proposals for expanding the federal role to directly fund institutions that successfully graduate low-income students and/or that ensure that students do not face unmanageable tuition prices. But absent a detailed, practical plan for moving in this direction, the Commission focused on needed improvements to the federal student aid system.
Continue to Reform the Pell Grant System
The Pell Grant program is the foundation of federal student aid, providing grants to low- and moderate-income students that they can use at the accredited postsecondary institutions of their choice. In 2016–2017, 7.1 million students received $27 billion in Pell Grants.81 But the application process and eligibility formula for Pell are complicated, and too many students do not access the aid they need. Moreover, requirements for institutional participation are weak, and many students, particularly those from disadvantaged backgrounds, do not receive adequate guidance about where to use these federal funds.
The federal government has made progress in recent years in making it easier to apply for Pell Grants and other federal financial aid. The Data Retrieval Tool that allows applicants to automatically transfer data from their past tax returns to the Free Application for Federal Student Aid (FAFSA) form eases the process for many students.82 As of 2017–2018, aid eligibility is based on earlier income data than was previously required, making it easier to complete the application in a timely manner. The Commission looks forward to further simplification and very possibly the elimination of the FAFSA, with the award of Pell Grants based on information the government already has from past tax returns. In the meantime, programs that assist lower-income students and their families with the financial aid application can have a significant impact on the likelihood that these students will apply to and attend college.83
The Pell Grant program was designed to increase college access by putting money in students’ pockets, but it should also support completion. Under current policy, full-time enrollment is defined as 12 credits per semester, and students enrolling for 15 credit hours—the average needed each semester to complete a bachelor’s degree in four years or an associate’s degree in two years—do not receive additional Pell Grant funds. Students who enroll for 12 credits each semester for five years receive five full Pell Grants—25 percent more federal funding than those who enroll for 15 credits each semester for four years, completing the same 120 credit hours.
The recent reinstatement of “summer Pell,” which allows students who exhaust their annual Pell allocation in the fall and spring to receive additional funding if they enroll for additional credits over the summer, is a step in the right direction. An even better solution would be to allocate the same funding to all students who enroll for 30 credit hours, no matter how those hours are distributed over a 12-month period.
Simplifying the federal student aid system and making it more flexible is important, but it is not enough in itself to promote good choices for students aiming to attend college. The federal government should take an active interest in promoting better college counseling in high schools (as should the states) and also in providing easy guidance and information channels for adults returning to college. This is more than a matter of detail. A great deal of resource waste results from people making poor choices about where (or sometimes whether) to go to college. Purposeful and proactive measures to provide better guidance are essential. All partners in the process should incorporate insights about how people actually make decisions into their efforts to support constructive choices and behaviors among students.
Make Student Loan Debt Manageable
Any discussion of financing college must address the rising levels of student debt. The country faces significant challenges in ensuring that all those who want to and are ready to attend college can afford to do so. More undergraduates borrow money to finance their education, so that today almost 60 percent of all two- and four-year college graduates have taken out loans, with an average cumulative loan amount of $20,000 (see Figures G and H).
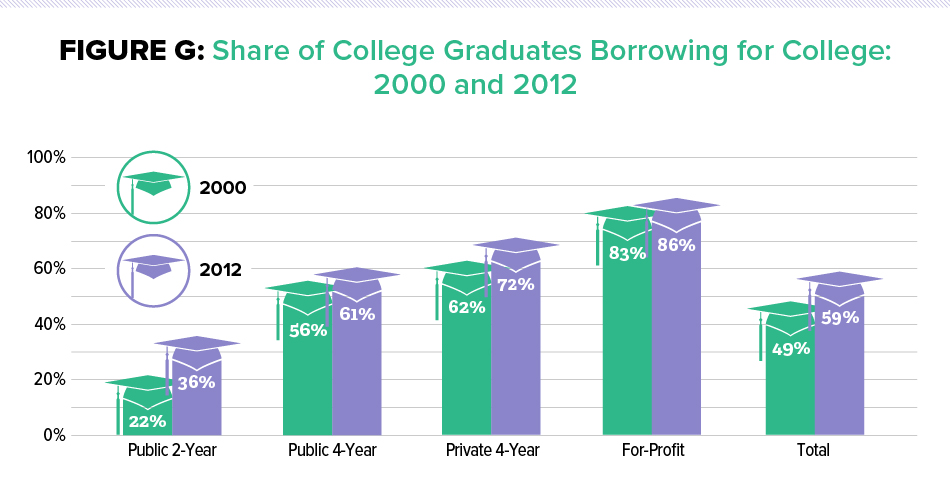
SOURCE:A Primer on the College Student Journey (American Academy of Arts and Sciences, 2016)
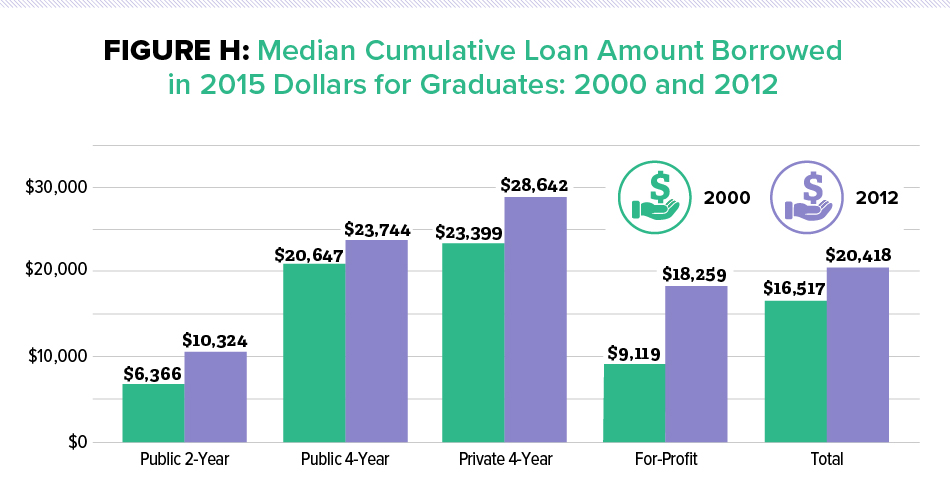
SOURCE:A Primer on the College Student Journey (American Academy of Arts and Sciences, 2016)
Among students with larger-than-average debt totals, the share of bachelor’s degree recipients graduating with $40,000 or more (in 2012 dollars) in debt rose from 2 percent in 2003–2004 to 18 percent in 2011–2012.84 The share of associate’s degree recipients borrowing $30,000 or more rose from 1 percent to 8 percent over these years.85 This debt is concentrated in the for-profit sector, where the increase was from 1 percent to 28 percent. Almost half of bachelor’s degree recipients in this sector borrowed $40,000 or more, compared with 20 percent in private nonprofit and 12 percent in public institutions. Over this period the share of students attending for-profit colleges grew, implying that rising debt levels are at least partially attributable to changing enrollment patterns.
It may be counterintuitive, but the students who struggle most with student debt are not those who borrow the most but those who do not complete their programs. The central issue is whether students complete credentials of value. Default rates are much higher for students who do not graduate than for those who complete credentials, and default rates are inversely related to amounts owed (see Figure I). Students who graduate from private nonprofit, four-year colleges—the highest-priced institutions—have the lowest default rates.86 Thus, increasing the rates at which students succeed in completing their undergraduate programs—and doing so in a timely way—is likely the best antidote to unmanageable student debt.
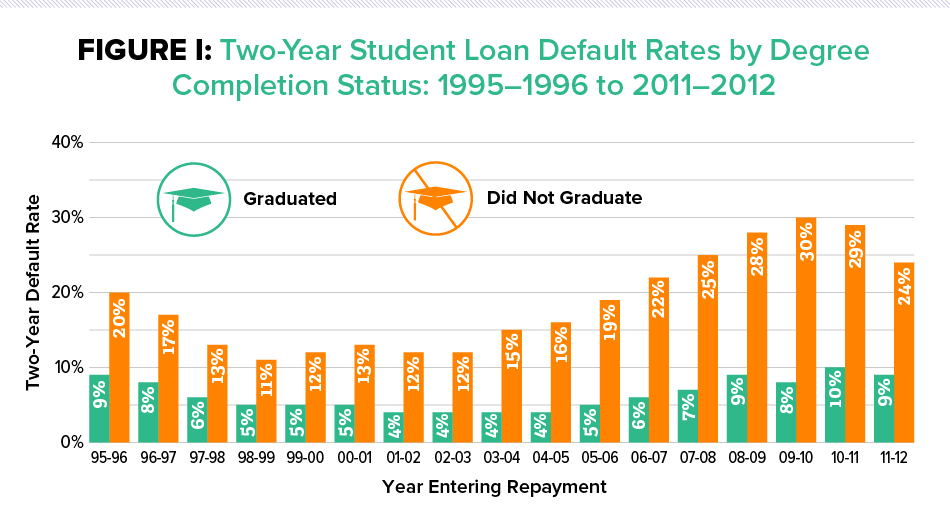
Two-Year Cohort Default Rates, Borrowers Entering Repayment in 2011–2012
| Public 2-Year | Public 4-Year | Private Nonprofit 4-Year | For-Profit | All | |
| All Borrowers | 23% | 9% | 7% | 18% | 14% |
| Borrowers Who Did Not Graduate | 29% | 18% | 15% | 28% | 24% |
SOURCE:A Primer on the College Student Journey (American Academy of Arts and Sciences, 2016)
There are very real problems facing a subset of students who have borrowed and will borrow for college. But these problems will best be solved by focusing on the particular difficulties facing students in specific circumstances, not by devising broad-brush plans for eliminating or minimizing student debt. Specific recommendations for reforming the student loan system include the following.
Design a Single Income-Driven Repayment System
A college credential is a solid investment that pays off very well for most students in financial terms, as well as through increased opportunities for personal development and civic participation. It is reasonable for most students to finance part of the cost of their education by borrowing and repaying their loans out of future incomes. However, the returns to education vary dramatically, and a strong income-driven repayment program that allows students to pay back their loans based on income levels is a critical component of encouraging people to enroll and persist in college.
The federal government should improve its valuable yet confusing income-driven repayment (IDR) plans for student loans. IDR programs link an individual’s monthly college loan payments to the person’s income level and family size—making the payments an affordable percentage of income. If the debt is not completely paid off by a set time (10, 15, or 20 years, depending on which of several programs a student is enrolled in), the remaining debt will be forgiven. The risks to borrowers from holding federal student debt have been significantly reduced by growing access to these systems, which now enroll more than a quarter of borrowers and account for almost half of outstanding debt. But these options are much more complicated than they need to be—one problem, for example, is the recertification process, which requires participants to provide income information annually. And there is a real risk that repayment and forgiveness rules have become so generous that they will impose large burdens on the federal budget as more students reach the stage where loans are forgiven.
Both Australia and England successfully implemented income-based loan programs about two decades ago, relying on their tax systems to determine and collect payments. Congress should design a single income-driven repayment plan that will become the standard way students repay their college loans. Eliminating bureaucratic hurdles will go a long way toward reducing default rates and diminishing the hardships borrowers face. The use of payroll withholding for collecting payments will ease the process for borrowers and ensure that borrowers will assign student loans higher priority on their list of personal financial responsibilities. (Borrowers tend to prioritize car loans over student loans to avoid having their cars repossessed. Because other forms of unsecured debt generally charge higher interest rates than federal student loans, borrowers may pay off other debts first, electing to defer or even default on their student loan payments.) The plan should be designed to subsidize the borrowers who need and deserve subsidies, but it should also require, and provide incentives for, most borrowers to eventually repay their debts. It should not encourage excessive borrowing or transfer a disproportionate amount of risk to taxpayers. The latter will undermine public support for the whole program and in time drain it of resources. It is critical to find the correct balance here.
Introduce a Risk-Sharing Program into the Federal Loan System
In addition to strengthening the student loan repayment system, the federal government should ensure that institutions have a stake in their students repaying their loans. This idea is taking hold both among members of Congress and among policy analysts, but designing the details of such a system is challenging. One recent proposal, for example, recommends that institutions whose students have poor repayment records be required to repay the federal government a fraction of the unpaid debt of their students.87 For most institutions, this fraction would be modest, but for schools with very low repayment rates, the penalties could be substantial. The Commission does not wish to endorse this particular effort, in comparison to the many other related proposals, but a plan along these lines could be a valuable tool for reducing student borrowing and for moving students to institutions where they are likely to succeed.
Track Satisfactory Academic Progress across Institutions
The low payoff for enrolling in college and leaving without a credential and the associated problems with student debt make it imperative that the student aid system promote completion, in addition to access. The Commission’s recommendation to allocate Pell awards to students who enroll for 30 credit hours over a 12-month period, no matter how those hours are distributed, is an important piece of this effort. Another constructive step would be ensuring that students are making satisfactory academic progress—passing their classes with at least a C average—as they move from one institution to another. The current federal financial aid system requires students to make academic progress at a single institution to maintain eligibility for financial aid. If students fail to meet these academic requirements, they lose eligibility for federal financial aid. But when students transfer to new undergraduate institutions, their academic history is not relevant. A significant fraction—one-third of first-time undergraduate students—transfer from one institution to another or enroll at the same time at two institutions at least once over six years. Some of these students move from one college to another because they have not been able to succeed academically. This allows students a second chance, but also supports a potentially long string of unsuccessful college experiences, with debt building up along the way. The federal student financial aid system should track students as they move across undergraduate institutions to ensure they are making academic progress. If not, then as with students who stay at one institution, students who “swirl” unsuccessfully would not be able to accrue more federal debt at a new institution.
Encourage Students to Attend Institutions and Programs with Strong Outcomes
Rising tuition prices combined with increases in living expenses and stagnant or declining household incomes have made paying for college more difficult for students and families. But whether college is affordable in a meaningful sense depends on how well it pays off in terms of future earnings. If students do not complete their programs or if they earn credentials with little value in the labor market, they have not made a good investment—whether or not they borrowed to finance the investment.
Even across institutions that serve similar students, there is tremendous variation in how successful students are in completing their programs. The use of public money to send students to institutions where their chances of graduating may be as low as 10 percent is difficult to rationalize—as is, for that matter, encouraging students to invest their own time and resources in such institutions. The federal government should encourage students to attend high-performing programs and institutions by strengthening the requirements for institutional participation in federal financial aid programs. The Commission urges the federal government to take more responsibility for limiting the colleges at which students can use their federal student aid to those that meet reasonable minimum performance standards and to provide stronger guidance to students about where and what to study.
Provide Incentives to States to Support Low-Income Students
The Commission supports the development of strong federal incentives for states to more generously fund public undergraduate education institutions. The goal is not to reduce the tuition prices students pay to zero but to reverse the trend of states backing away from providing significant subsidies to the colleges and universities that educate most students. The general subsidies to institutions should be complemented with need-based aid to make it possible for students who cannot afford even subsidized tuition to enroll.
A straightforward approach could be modeled after the Leveraging Educational Assistance Program, which was established in 1972 but eliminated in 2011. Under this program, the federal government provided matching funds for state need-based aid programs. This approach is consistent with the federal role in awarding grant aid to students with financial need and would use federal dollars to leverage well-targeted state funds.
The federal government plays an important role in diminishing financial barriers to postsecondary education. The billions of dollars devoted to this effort would be more effective if federal student aid programs were better designed. Nonetheless, state governments will continue to bear much of the responsibility for ensuring the availability of high-quality, affordable education.
The Role of State Governments
The historical role of public colleges and universities is to provide quality educational opportunities to the states’ residents. Recognition of the importance of an educated citizenry and labor force for the society motivates public subsidies of colleges and universities while leaving students and their families responsible for a fraction of the full cost of their education. This commitment to access to and affordability of a public undergraduate education helps explain why public two-year and four-year institutions account for almost 80 percent of undergraduate enrollments every fall. And this is a good investment for individuals and for the American public. Individuals benefit from higher earnings and the important nonmonetary benefits of college. States benefit from higher taxes paid by a more educated workforce, as well as from the civic and broader economic benefits of a more educated population.
There has been a long-term downward trend in the extent to which states provide undergraduate education subsidies to their residents. Total state and local funding at the national level has increased 10 percent over the last 25 years, but large increases in the number of enrolled students have meant that per student funding has declined sharply. The national average state appropriation per student in 2016 was $7,116 compared with $8,616 (in 2016 dollars) in 1991, a 17 percent drop (see Figure J).88 State and local funding has not kept up with enrollment growth.
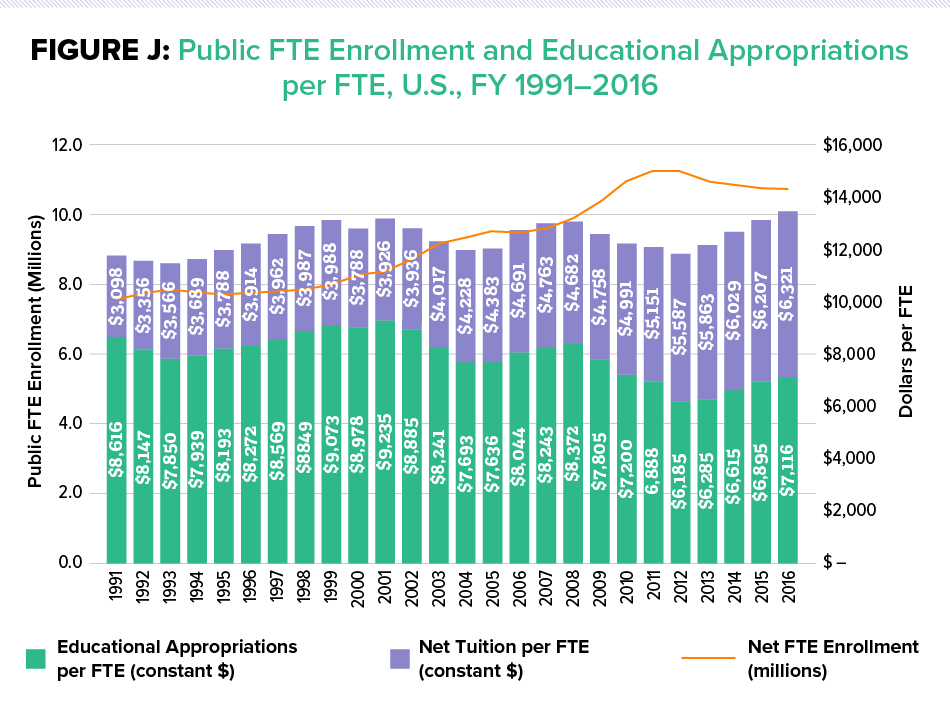
SOURCE: State Higher Education Executive Officers. State Higher Education Finance FY 2016.
Notes: Net Tuition revenue used for capital debt service included in the above figures. Constant 2016 dollars adjusted by SHEEO Higher Education Cost Adjustment (HECA).
Higher education is the third-largest priority in state general fund budgets (the portion financed primarily by taxes) after elementary and secondary education and Medicaid. But states are dedicating a declining percentage of their resources to higher education. Other obligations of state governments, especially Medicaid, prisons, and infrastructure, demand an increasing share of the pie, and political pressures to cut taxes reduce the total amount available to cover these needs. The result has been a squeeze on funding for undergraduate education. For example, in fiscal year (FY) 1995, higher education constituted 12.9 percent of general fund spending, while in FY 2015 it was only 9.9 percent. During that same period, Medicaid went from 14.4 percent to 19.7 percent of state spending.89
The decline in the role of state appropriations in covering the cost of educating students helps to explain rising public college tuition levels.90 While the Commission regards it as extremely unlikely that state governments will fully recover their former financing role, continued decline threatens access to public institutions for students who cannot afford to pay or who are more expensive to educate because of lack of preparation. It also threatens the economic vitality of the states themselves, because many large and small companies, domestic and international, place new plants and research centers near campuses to tap the talent pool they create. If the talent pool shrinks because of financial constraints, so, too, do the incentives to invest in the areas around colleges and universities, diminishing future job opportunities and the future tax base of the region.
Fiscal pressures on states and on state-run colleges and universities are likely to be unrelenting, and it is essential that both government decision-makers and leaders on campus focus on directing resources to the highest priorities. Nothing will do more to encourage a state’s residents and leaders to support the cause of public higher education than clear evidence that available dollars are being used well. The Commission believes some of the general points offered below apply broadly to states’ higher education policies and practices, but it also recognizes that every state is different both in the needs of its students and in the economic and civic role higher education plays in the state.
Direct Scarce State Resources to the Students for Whom They Will Have the Greatest Impact
It is not just overall state funding levels that shape the affordability and effectiveness of a public college education. States also face the dual challenge of allocating their operating subsidies across different types of institutions with different missions serving students with differing levels of financial need, while also helping to ensure that the needy students within institutions get the financial help they require for successful attendance. A substantial number of states operate their own financial aid operations, with helping needy students as one of their goals.
The Commission urges state governments to weigh carefully the balance of their funding across types of public institutions, recognizing the distinctive contributions made by research universities, regional comprehensives, and community colleges. Because the roles of these different types of institutions differ greatly, as do the backgrounds and aspirations of their students, no simple formula can determine how much support each institution should receive from the state. The Commission believes it is important to recognize that community colleges and regional comprehensive universities disproportionately educate first-generation college students and those from disadvantaged backgrounds, populations that have historically been neglected in American higher education. Few of these students can contribute much in dollars to their own education, and they have good reason to avoid excessive debt. Yet despite these challenges, these institutions can and often serve, in a memorable phrase invoked by Raj Chetty and John Friedman, as American “engines of opportunity.”91 These colleges and universities, serving students who often have had to overcome deficient preparation for college in underresourced elementary and secondary schools, require sufficient resources to provide the academic and social supports their students need.92 That said, like all colleges, these places should be able to demonstrate success in educating the populations they serve.
In calling attention to these broad access institutions, the Commission does not intend to signal that the remarkable accomplishments of many of the nation’s leading public universities can be discounted. The American Academy’s extensive Lincoln Project found that public research universities are responsible for conducting much of the nation’s core research; serve as anchors of economic stability and growth in their regions; and function as centers of cultural learning with their museums, theaters, and athletic centers open to the public.93 Moreover, many flagships make special efforts to recruit and provide financial support to qualified disadvantaged students: 31 percent of undergraduate students who attend public research universities receive Pell Grants.94 Each state has a different mix of populations, institutions, and needs, and each must weigh its own priorities thoughtfully and with attention to evidence.
Many states complement their general state subsidies to institutions with state-run student aid programs. These aid programs often serve multiple purposes, including encouraging students to stay in the state for college, rewarding good performance in high school, and directing a portion of state funding toward private colleges, in addition to increasing educational access and attainment. Without questioning the legitimacy of these aims, the Commission believes that prominent among the goals of state student aid policies should be meeting the financial need of highly disadvantaged students. Depending on family resources, many qualified students may be unable to attend the public flagship or even a nearby community college without additional funding to supplement federal grant assistance. Not only tuition and fees but living expenses can make college unaffordable.
Most states with grant programs award funds on the basis of both need and merit.95 While multiple goals for these programs make sense and are probably necessary for political sustainability, in the Commission’s view directing funds toward students with substantial financial need should be a high priority—and should be supported with federal incentives.
Align Funding with Completion
Traditionally, state higher education systems have tied the operating subsidy going to an institution to the number of students enrolled. In such systems, schools are paid for filling their classrooms, regardless of how much progress the enrolled students make toward completion. As the nation puts greater focus on program completion, paying schools simply for enrolling students is misaligned with the goals state leaders want institutions to pursue. It can also interfere with the goal of reducing time-to-degree. To their credit, many institutions have pursued completion goals even in the absence of clear budgetary rewards for doing so, and many states have instituted performance-based funding policies.
Policy-makers at both the state and federal levels should work with colleges and universities toward improved alignment between funding and program completion. This is a difficult challenge to manage adroitly, for at least two reasons. First, a college can sometimes raise its completion rate by recruiting students who have better graduation prospects, but the true goal is to have colleges do better with the students they have. Second, the aim of such a program should be not to reward programs for the graduation rates they already have but to reward improvement. Developing sound ways to respond to these dual challenges requires serious work on policy design and measurement tools, tasks that the research community and federal and state policy analysts need to focus on. So far these matters have been addressed at the state level through fully elaborated performance-based funding systems. The track record of such systems has not been entirely encouraging, at least in part because of excessive complexity and because they have involved only a small share of overall state funding. However, continually evaluating these systems and modifying them based on evidence of effectiveness and of unintended consequences holds real promise. Much simpler practices, like allocating some dollars from enrollment-based funding to a stream of funding per graduate, can also help improve alignment, especially if the added funding is focused on graduating high-risk students.
Coordinate State Agencies in Developing Comprehensive Student Support Strategies
Many students, whether coming straight out of high school or adults returning later to college, face multiple social and personal challenges that can range from homelessness and food insecurity to childcare, psychological challenges, and even imprisonment. Colleges are in many cases not the institutions best equipped to meet these multiple needs and challenges. Some of these challenges can be attended to within the campus environment (childcare in some cases) or even by bringing the campus to the student, as in college programs at prisons. Yet often the best solutions can emerge from building cooperation between a college and relevant social support agencies. These are innovations that states can do a good deal to support and even subsidize.
Recognizing the interaction between college affordability, academic preparation, college success, and career outcomes is key to developing sound and comprehensive strategies. The focus should not be entirely on lower prices and more grant aid but include ways of linking other social support mechanisms, such as subsidized housing benefits, childcare, transportation subsidies, and earned income tax credits in recognition of the fact that, for many low-income students, tuition is but one of many challenges. Federal and state governments should coordinate their dollars on comprehensive supports and incentives to institutions to improve the chances of students from low- and moderate-income backgrounds to earn college credentials of value.
The Role of Colleges and Universities
The introduction to this section of the report notes that the role of higher education institutions in the education system is to draw on resources provided by others (students, parents, state and federal governments, and philanthropy) to produce the educational services students and the nation value.96 Colleges and universities have choices to make about how to deploy the resources they have, and these choices affect both how much students pay and the return on their investment in undergraduate education. Many colleges and universities have considerable discretion over the tuition prices they set, the amount and distribution of discounting they do from that price through institutional grant aid, and the way the resources of the institution are deployed in producing education. Decisions about all these matters are constrained by market conditions and by economic and (especially for public institutions) political trade-offs.
Making good decisions about all these matters in the constrained economic environment that faces colleges now and for the foreseeable future is no easy task, and it is all too easy to stand on the sidelines and demand that colleges simply produce better education for less money. Nevertheless, without presuming to wave a magic wand, the Commission believes that evidence is accumulating about ways colleges can significantly improve some of their practices. Increasing numbers of institutions of all types are taking serious steps to manage costs through eliminating lower-priority academic and nonacademic programs, cutting faculty positions, and reducing library services, among other steps. More colleges have developed comprehensive financial models establishing annual cost targets accompanied by well-considered strategies to meet them.97 Cost-saving partnerships with other educational institutions, as well as with business and industry, have become more common. These are all laudatory measures that require significant effort and persistence, for which these institutions should be recognized.
The practices identified below are ones for which there is significant evidence of effectiveness and which the Commission believes are especially worthwhile for institutions to pursue in service to quality, completion, equity, and affordability.
Invest in Providing Students with Consistently Good Teaching
Our first priority in this report is to give more widespread and sustained attention to the quality of teaching and learning in undergraduate education. It is important not simply for students to have the occasional outstanding teacher but for them to have consistent, purposeful instruction throughout their college experience. Evidence supports the view that consistent good teaching raises student learning and satisfaction and, importantly, raises persistence in challenging majors, as well as degree completion.98 Changing the culture and expectations around teaching in a department or an institution requires upfront investment. But once in place, strong and effective instructional systems can better meet institutional and social goals without being more expensive than the less-reliable teaching practices they replace.
Build Governance Practices That Support Cost-Saving Innovation
It is hard to picture any high-quality college or university operating successfully as a top-down “command and control” organization. Education is a fundamentally cooperative enterprise animated by shared values and goals. Yet it is clear that in order to make their greatest contribution to the future of the economy and society, colleges and universities are going to have to become better at making tough decisions and opening themselves to experimenting with new and potentially better ways of accomplishing their missions.
The Commission believes colleges and universities of all types need to develop a more robust conception of “shared governance” than has historically been the case.99 In practice, shared governance has often meant “divided authority,” with faculty controlling the curriculum, administrators controlling the budget, and regents or trustees attending to the institution’s long-run financial viability. The Commission foresees a future in which these interdependent elements of curriculum, budget, and long-run finances will need to be managed through deep collaboration among all parties.
Even though faculty, administrators, and trustees will naturally view the institution through different lenses, they share an interest in the institution’s financial success and, even more, its vitality in achieving its mission. Achieving shared goals will require greater openness and more candid discussion among all parties than currently prevail. Concretely, faculty should not insist that their traditional authority over curriculum should serve to preclude experimentation with new modes of instruction, including innovative uses of technology and elements of distance learning. Administrators in turn need to cultivate practices of keeping the community fully informed about fiscal and budgetary matters and follow a rule of “no surprises” in instituting major budgetary and program changes. And trustees should learn about the history, values, and traditions of the institution they serve and be open to honest dialogue about how best to advance the institution’s long-run vision and mission.
Moving in these directions entails risks for all concerned—risks to faculty autonomy, to administrators’ discretion over program and budget, and to trustees’ ability to stay above the fray of campus debate. But there is, the Commission believes, no pathway to long-run success for higher education that avoids these risks.
Reduce Costs per Graduate through Timely Progression to Degree Completion
The Commission argues that improving program completion rates is a major priority for American undergraduate education. Timely completion of degrees and certificates has major benefits for students in terms of economics, personal satisfaction, and civic involvement.
Timely completion for students is also valuable in making colleges more efficient and cost-effective. Students who are enrolled for seven years to earn a bachelor’s degree or five years for an associate’s degree are consuming institutional resources even as they are wasting their own precious time. Moreover, completions are much more valuable to students and society than attendance without a credential. Higher completion rates can generate lower costs per degree, even when more resources are devoted to each student. In other words, raising the completion rate can be a cost-reducing strategy.
As highlighted in the previous section, a growing number of universities and community colleges are successfully raising completion rates through a carefully designed process that helps keep students on track to graduate. An important common element in this emerging work is that it begins with a significant investment in data and measurement tools, including “big data” that can help an institution identify the factors that predict a student with certain characteristics is showing early stages of academic or personal difficulty. Coupling this knowledge with rapid assembly of data about the current progress of students on campus supports timely interventions and counseling to keep students on track. By making progress to a degree more likely, these efforts at once bring the college closer to a major goal and reduce the costs per graduate—a more meaningful measure than costs per enrollee. A cost-benefit analysis of CUNY’s ASAP program found that although the program requires more resources per student than traditional associate’s degree programs, the cost per graduate is lower because of its much higher effectiveness in producing graduates. The study also found that for each dollar of investment in ASAP by taxpayers, the return was between three and four dollars—arising from higher tax revenues and lower costs of spending on public health, criminal justice, and public assistance.100
Readers with a business background will recognize the close parallel between this kind of work and efforts toward “continuous improvement” and “process reengineering.” The common element is a deliberate and ongoing effort to understand what the processes at work in an enterprise are intending to do and then focus on how to make them work more reliably and with less waste.
It is important to recognize that these are quality improvement and cost-saving strategies that can be undertaken now, without waiting for big technological improvements in teaching. New educational technologies indeed hold great promise for the future but are not yet ready for widespread adoption without undue risk, especially to disadvantaged students. Depending upon how they are developed and deployed, these technologies have the potential to increase inequality by providing experiences of lesser quality for some students while enriching the experiences of other students. Active experimentation with varieties of technology-enhanced instruction is needed, and institutions need to learn much more before widespread adoption of these technologies is warranted. There is real potential for expanding opportunity and better managing costs, but institutions should approach this effort with a commitment to quality and equity.
Governance and financing practices at the state level should align with these process-improving strategies, a point noted above, in the context of the role of the states. Such reform practices take time to evolve and sometimes require upfront investment before they pay off.
Direct Financial Assistance to Students Who Need It
Colleges and universities have many reasons for offering some students admission at a reduced price. Student ability to pay is a big factor, with institutions offering “need-based” awards to students who could not otherwise afford to attend. But awards for academic or athletic achievement are also common, and colleges may also offer discounts for musical talent, prowess in debate, or any number of other characteristics. Colleges may see such “merit” awards as useful tools in shaping their entering class in desired ways. But when different institutions have similar definitions of merit, such as scores on SAT or ACT exams, they may find themselves in a “bidding war” for the same students, with the result that scarce institutional resources go to students and families who could well afford to attend without the aid. Because colleges have limits on how much tuition revenue they can afford to forgo, merit awards frequently wind up competing with need-based awards for scarce aid dollars.
Institutions should carefully assess their student aid strategies to meet institutional missions, prioritizing aid to students who are most financially needy. Access and equity are fundamental to the role of undergraduate education—and to the nonprofit status of most colleges and universities.
A relatively small subset of colleges and universities that have more resources than most other institutions compete for well-prepared, affluent students at the national and international levels. They provide costly amenities such as well-appointed dormitories, expansive fitness centers, and elaborate dining facilities to attract students who can choose among prestigious colleges. While these amenities may respond to student demand, many add to institutional expenses with little or no educational impact. The Commission urges institutions, whenever possible, to direct their competitive efforts to raising the educational quality of their offerings and increasing opportunities for social mobility to a greater fraction of aspiring students.
Provide Students with Clear Information about Price
Many students and their families, and lower-income families in particular, rule out schools that they can afford because the so-called sticker price—the information about tuition, fees, room, and board published on college websites and in admissions brochures—appears to be too high. The sticker price shows how much students must pay to attend a school before subsidies such as grants and scholarships are awarded. In reality, the “net” price is consistently lower than the sticker price, and about two-thirds of students pay the lower net prices compared to the higher sticker prices.101 Unfortunately, many students and their families turn away from applying to colleges based upon the sticker price, and some decide not to attend college at all. Colleges and universities that genuinely want to elicit applications from qualified students of all academic backgrounds should work hard on communication strategies that help with this problem.
Another area in which greater transparency is needed is in communication with students after they are admitted and awarded financial aid. A student who is offered aid at several institutions is likely to receive “award letters” that look very different from one another, even if the bottom line of each turns out to be the same. A national effort to standardize these communications would be worthwhile. Failing that, it is essential that each institution make clear what the student and their family will be required to pay, and what options, including loans, summer employment, and Federal Work-Study, will be available for helping to finance those expenses. Colleges also need to work very hard to make sure students understand the obligations they enter into in agreeing to a loan.
Regulatory Matters
In recent years, state, federal, and accreditor regulations have been criticized for obstructing progress and innovation and adding unnecessary and wasteful costs to colleges and university budgets. The Task Force on Federal Regulation of Higher Education, a group of college and university presidents and chancellors created by a bipartisan group of U.S. Senators, recently released an analysis recommending that regulation not related directly to institutional quality and improvement be identified and, where possible, eliminated.102 The Commission supports such an exercise.
And while the most vigorous critique of regulation has focused on federal rules, state agencies and accrediting bodies should also engage in a thoughtful review to identify regulations and other policy barriers that may impede the spread of innovation across colleges and universities. Regulations that do not contribute to protecting students by insisting that providers meet rigorous quality standards should be reviewed and, where possible, rolled back. Conversely, greater regulatory attention and compliance should be directed at institutions that are chronically poor performers. A better relationship between important regulatory protections and the promotion of innovation can be achieved through thoughtful action at the state, federal, accreditation, and institutional levels.
ENDNOTES
79.A Primer on the College Student Journey.
80. See Judith Scott-Clayton, Undergraduate Financial Aid in the United States (Cambridge, Mass.: American Academy of Arts and Sciences, 2017) for a full discussion on undergraduate student financial aid.
81. Support for veterans is the second-largest federal grant program, distributing almost $12 billion in educational assistance in 2016–2017.
82. The IRS Data Retrieval Tool was first made available for the 2009–2010 school year and later shut down in March 2017 by the IRS due to concerns about misuse of information by identity thieves. It returned on October 1, 2017, and is available to use with the 2018–2019 FAFSA form.
83. See Eric P. Bettinger, Bridget Terry Long, and Philip Oreopoulos, The FAFSA Project: Results from the H&R Block FAFSA Experiment and Next Steps (Cambridge, Mass.: Harvard Graduate School of Education, 2013); and Page and Scott-Clayton, “Improving College Access.”
84. College Board, Trends in Student Aid 2014, 23, Figure 14A, https://secure-media.collegeboard.org/digitalServices/misc/trends/2014-trends-student-aid-report-final.pdf.
85. Ibid., Figure 15A.
86. Only 9 percent of student borrowers who graduated from college in 2012 went into default on their loan repayments, compared with 24 percent of the student borrowers who did not graduate. Further, students who graduated from private nonprofit four-year institutions had the lowest default rates (5 percent), while students who borrowed but did not graduate from community colleges and for-profit institutions had the highest default rates (29 percent and 28 percent, respectively). While default rates are similar in the for-profit and two-year public sectors, the vast majority of for-profit students borrow, while nearly two-thirds of community college graduates do not take out student loans. See A Primer on the College Student Journey, Figure R.
87. Tiffany Chou, Adam Looney, and Tara Watson, A Risk-Sharing Proposal for Students, Policy Proposal 2017–04 (April 2017), The Hamilton Project, http://www.hamiltonproject.org/assets/files/risk_sharing_proposal_student_loans_pp.pdf.
88. State Higher Education Executive Officers, http://www.sheeo.org/sites/default/files/project-files/SHEEO_SHEF_2016_Report.pdf.
89. In FY 2016, elementary and secondary education was the largest category, representing 35.1 percent of general fund expenditures, with Medicaid second at 20.3 percent, and higher education at 9.7 percent.
90. As per student state funding has declined, federal aid has increased, more than doubling from $53 billion in 2000 to $122.7 billion in 2014. Debate continues about the interplay between these trends, with some arguing that increased federal financial aid lets states off the hook, making it too easy for institutions to raise tuition. There is no doubt that the strain on state budgets, especially during the recent recession, pressed the federal government to contribute more. The federal government can and should run deficits in recession to stimulate the economy, while most state constitutions prohibit state borrowing for operating expenses. Are states more ready to make cuts to undergraduate education because they know there is a good chance of federal help? Most likely. Is the federal government more likely to spend money when state cuts are causing public institutions to turn away students because they cannot afford to educate them, as happened in some places during the recession? The Commission hopes so. But these dynamics are the result of discretionary judgments by political actors, not mechanical formulas put in place to make this happen.
91. Raj Chetty et al., Mobility Report Cards: The Role of Colleges in Intergenerational Mobility, July 2017, http://www.equality-of-opportunity.org/papers/coll_mrc_paper.pdf.
92. David Deming and Christopher Walters, “The Impacts of Price and Spending Subsidies on U.S. Postsecondary Attainment,” NBER Working Paper, January 2017, show that increasing available funds at public colleges is associated with better student performance—in fact, investing in the institution is more effective than investing in student aid.
93. The Lincoln Project, https://www.amacad.org/content.aspx?d=22174.
94. The Lincoln Project, Public Research Universities: Serving the Public Good (Cambridge, MA: American Academy of Arts and Sciences, 2016), 15, note 4.
95. National Association of State Student Grant and Aid Programs, “46th Annual Survey Report on State-Sponsored Student Financial Aid,” 2014–2015 Academic Year, http://www.nassgap.org/survey/NASSGAP_Report_14-15_final.pdf.
96. A relatively small number of institutions have substantial endowments, reflecting accumulated savings from past gifts that support the educational operation. In 2015, five private institutions, out of more than 500 reporting data on endowments, held 25 percent of all the endowment funds in that sector. The same is true of the top six public institutions. The endowment of the median private institution, out of more than a thousand places reporting endowments, is not large enough to contribute as much as $1,000 to the cost of educating their average student. Among more than 500 public institutions reporting, the median endowment can contribute less than $250 per student. See National Center for Education Statistics, IPEDS (Integrated Postsecondary Education Data System) (U.S. Department of Education, Institute of Education Sciences), https://nces.ed.gov/ipeds/.
97. See William F. Massy, Reengineering the University: How to be Mission Centered, Market Smart, and Margin Conscious (Baltimore: Johns Hopkins University Press, 2016).
98. See Carl Wieman, Improving How Universities Teach Science: Lessons from the Science Education Initiative (Cambridge, Mass.: Harvard University Press, 2017); Pallas, Neumann, and Campbell, Policies and Practices to Support Undergraduate Teaching Improvement; and Kurzweil and Martin, The Complex Universe of Alternative Postsecondary Credentials and Pathways.
99. Bowen and Tobin, Locus of Authority; and Bowen and McPherson, Lesson Plan.
100. Levin and Garcia, Benefit Cost Analysis.
101. See A Primer on the College Student Journey, 26, note 42.
102. Task Force on Federal Regulation of Higher Education, Recalibrating Regulation of Colleges and Universities (2015), http://www.acenet.edu/news-room/Documents/Higher-Education-Regulations-Task-Force-Report.pdf.