Appendix: Case Study—The University of Minnesota
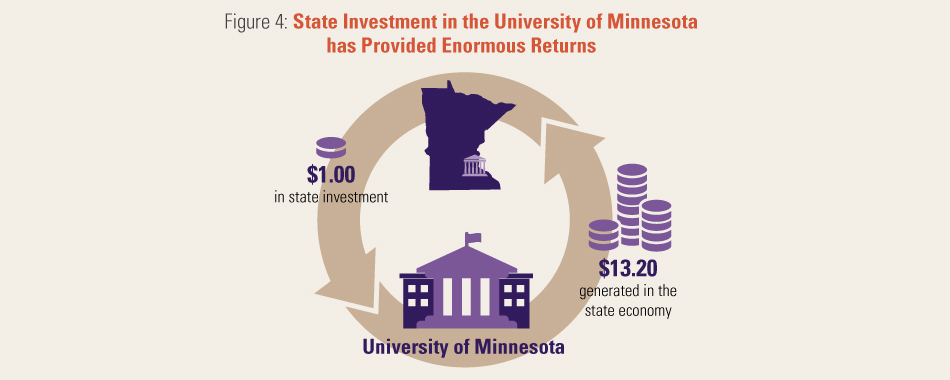 |
Data from FY2009–2010. Source: Tripp Umbach, The Economic and Societal Impact of the University of Minnesota (Pittsburgh: Tripp Umbach, 2011), 5, http://impact.umn.edu/assets/pdf/Final_Report.pdf.
“The last five decades reveal that college access is a strongly shared value among citizens and policymakers in Minnesota. In 1963, a legislative committee codified this value by creating the ‘35 mile rule,’ which demonstrated the state’s prioritization of access to higher education by establishing a college campus within 35 miles of every Minnesotan. As a result of the 35 mile rule, between 1963 and 1983 Minnesota developed more 2 year campuses per capita than nearly any state in the country. Many towns viewed a college campus as a community asset and encouraged development. Today a highly educated populace is the legacy of the 35 mile rule, evidenced by Minnesota’s ranking as the 8th best-educated state in the nation, with nearly 10 percent of Minnesotans holding advanced degrees and 63 percent with at least some college education.”51
– College Funding in Context: Understanding the Differencein Higher Education Appropriations across the States
Among the state’s public colleges and universities, the University of Minnesota serves the largest number of students (nearly seventy thousand each year).52 According to the most recent analysis, for 2009–2010, the University of Minnesota generated $8.6 billion in economic impact for the state, measured as dollars generated within Minnesota due to the presence of the university, both as direct expenditures ($4.1 billion) for goods and services by the university, its employees, students, and visitors; and indirect or induced spending ($4.5 billion) circulating within the state and supporting local businesses.53
 As of 2011, the University of Minnesota had eighty-seven extension county offices,
fifteen regional extension offices, seven research and outreach centers, and thirty-five
thousand volunteers to partner with educator-researchers. Staying true to their
mission as part of a land-grant university dedicated to serving its region, university
staff (including medical staff), faculty, and students routinely provide free medical
care, volunteer in local communities, and make donations to charitable organizations.
Estimates value these benefits to the Minnesota community at $204 million per year.54
As of 2011, the University of Minnesota had eighty-seven extension county offices,
fifteen regional extension offices, seven research and outreach centers, and thirty-five
thousand volunteers to partner with educator-researchers. Staying true to their
mission as part of a land-grant university dedicated to serving its region, university
staff (including medical staff), faculty, and students routinely provide free medical
care, volunteer in local communities, and make donations to charitable organizations.
Estimates value these benefits to the Minnesota community at $204 million per year.54
The University of Minnesota is also a hub of research, featuring an Academic Health Center, a Center for Magnetic Resonance Research, a Stem Cell Institute, an Institute for Translational Genetics, and MnDRIVE, which has resulted in 120 state projects among 354 collaborative researchers across multiple sectors, examining robotics, sensors, and advanced manufacturing along with global food ventures, treatments for brain conditions, and energy conservation.55 These centers and others span across diverse fields including mathematics, psychology, biology, and engineering.
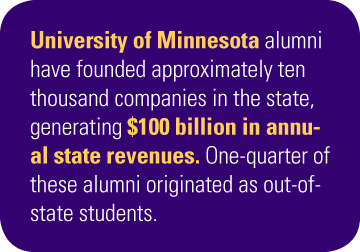
Over 65 percent of University of Minnesota students who have graduated since 1980 continue to live in the state. Alumni have founded an estimated ten thousand companies in the state, with one-quarter of the companies’ founders originating as out-of-state students. All together, companies founded by University of Minnesota alumni are estimated to generate $100 billion in annual revenues and employ five hundred thousand state residents.56
In 1983, the Minnesota state legislature passed the Design for Shared Responsibility, or the Funding Policy Statute (135A.01), which mandated state support of two-thirds of instructional costs at public colleges and universities. But the protection afforded by that statute has eroded over time and public universities in Minnesota, as in other states, have faced significant reductions in state funding. Minnesota now ranks tenth among states experiencing the sharpest decline in educational appropriations per full-time equivalent (FTE) student over the past five years (down 32.8 percent from FY2008 to FY2013).57 Meanwhile, FTE student enrollments have risen 7.4 percent during this same period, reaching 210,546 FTE students in FY2013.
ENDNOTES
51 Excerpt from David Weerts, Thomas Sanford, and Leah Reinert, College Funding in Context: Understanding the Difference in Higher Education Appropriations across the States (New York: Dēmos, 2012), 9. See also Kerry Kinney Fine, A History of Minnesota Higher Education Policy: A Policy Analysis (St. Paul: Minnesota House of Representatives Research Department, 1993).
52 University of Minnesota, Office of Institutional Research, “Campus and Unit Enrollment by Academic Level for Fall 2014,” http://www.oir.umn.edu/student/enrollment/term/1149/current/12863.
53 Tripp Umbach, The Economic and Societal Impact of the University of Minnesota (Pittsburgh: Tripp Umbach, 2011), 5, http://impact.umn.edu/assets/pdf/Final_Report.pdf.
54 Ibid.
55 See University of Minnesota, MnDrive: Minnesota’s Discovery, Research, and Innovation Economy, http://mndrive.umn.edu.
56 Tripp Umbach, The Economic and Societal Impact of the University of Minnesota.
57 State Higher Education Executive Officers (SHEEO) Association, State Higher Education Finance FY 2013 (Boulder, Colo.: State Higher Education Executive Officers Association, 2014), http://www.sheeo.org/sites/default/files/publications/SHEF_FY13_04292014.pdf.