Chapter 5: Science Education in the Age of Science
Chris Impey
Discussions of science education create a sense of déjà vu. Like major astronomical alignments, reports on the state of undergraduate science teaching within the liberal arts curriculum roll around every decade or so (American Association for the Advancement of Science, 1990; Boyer, 1998; National Research Council, 1999; this volume). Revolutions are all around us, in the burgeoning fields of genomics, astrophysics, nanotechnology, and many others. Science is outstripping the ability of even its practitioners to keep up beyond their area of research. What hope of keeping up do non-technical citizens have, especially when much of the information provided by mass media is fragmentary, inchoate, or misleading? The answer—and the onus—rests with scientists who teach college courses for non-science majors. One in four Americans is a college graduate, and that number will rise as higher education continues to offer career attainment and financial success.
Fortunately, educators have at their disposal a wealth of research that they can use to improve learning and retention in the classroom, as well as new technologies that can spur learning and curiosity in science. If we are to help students become more than just passive participants in the Age of Science, we must redouble our efforts to help them understand the great intellectual adventure that is reshaping the world.
The following quotations from A Tale of Two Cities (Dickens, 1859) set the scene by drawing contrasts between the vitality of scientific research and the imperfect grasp of science by our students and the general public.1 It was the best of times, it was the worst of times . . . Over the past fifty years, the employment of scientists and engineers in the United States has increased from two hundred thousand to nearly five million, with a corresponding growth in the number of research papers and knowledge. Yet support for academic research and development (R&D) is lower in inflation-adjusted dollars than it was thirty-five years ago, and R&D as a percentage of the U.S. gross national product (GNP) is lower than at most times since 1980.
. . . it was the age of wisdom, it was the age of foolishness . . . The fraction of Nobel Prizes in science going to Americans increased from 63 percent in the years 1951 to 1975 to 86 percent during the final twenty-five years of the last century. The number of natural sciences graduate degrees awarded has risen by 50 percent over the last twenty years. However, the U.S. Department of Health and Human Services Office of Research Integrity estimates that about one thousand cases of scientific misconduct go unreported each year.
. . . it was the epoch of belief, it was the epoch of incredulity . . . Americans believe in the value of scientific research. By a margin of four to one, they think its benefits outweigh any negative effects; by a margin of ten to one, they say the government should fund basic research. On the other hand, only one in three members of the public is aware of the Big Bang model; only half believe that we evolved from earlier species of animals; and one in four is unaware that Earth goes around the sun. Susceptibility to pseudoscience and supernatural explanations also remains stubbornly high.
. . . it was the season of light, it was the season of darkness . . . Science and technology have raised more than a billion people out of poverty worldwide in the past fifty years. In the same period, improvements in medicine have increased life expectancy by twenty years. Hanging over this success are the shadows of human-induced global climate change, the rise of pathogens and toxins in the environment, and the fact that the major powers retain more than twenty thousand nuclear weapons––enough to kill all humans many times over.
. . . it was the spring of hope, it was the winter of despair . . . Science and technology are young relative to the span of the human species and are enjoying a surge thanks to the exponentially increasing capabilities of computers and networks. If we can survive our troubled adolescence, the universe is our oyster. If we are representative of technological species, Drake’s equation puts a cosmic perspective on our dilemma by estimating the number of intelligent, communicable civilizations in the Milky Way. If we endure for thousands of years with our current capabilities, we are likely to have kinship among the stars. If our cultural instability is typical, we are likely to be short-lived and alone in the universe.
THE STATE OF SCIENCE EDUCATION
As with science, so with science education. In 2007, Career Cast, a major job search Web portal, evaluated two hundred jobs in terms of pay, stress, and work environment. Science and engineering jobs accounted for twelve of the top twenty and eight of the top ten most desirable positions. Yet the number of bachelor’s degrees in math, physical science, and engineering has been flat or falling for twenty-five years. Less than half of high school students take biology or physics, less than 20 percent take any calculus, and a majority of public secondary schools cannot fill all their math and science teaching vacancies. Technical training in the U.S. university system is the envy of the world; a third of advanced degrees in science and more than half of advanced degrees in engineering are awarded to foreign nationals. But many of the non-scientists coming out of the U.S. system are not scientifically literate, according to the National Science Foundation (NSF) surveys that are delivered to Congress every two years (for example, see National Science Board, 2008).
Meanwhile, not much has changed in the classroom since the report Reinventing Undergraduate Education (Boyer, 1998) slammed research universities for giving short shrift to undergraduates studying science. The body of peer-reviewed literature on the efficacy of collaborative learning and interactive modes of engagement is growing, but science is taught mostly by pure transmission, or lecture, and is evaluated based on the testing of facts, at the lower levels of a learning taxonomy (Bloom, 1956; Mintzes & Leonard, 2006). Bloom’s original schema divides learning into affective, psychomotor, and cognitive domains. Within the latter are six skills that range from low- to high-order learning: knowing, comprehending, applying, analyzing, synthesizing, and evaluating.
Compounding a traditional and ossified situation, the academy’s reward system continues to embrace a pyramid of values that places research above teaching and outreach, graduate students ahead of undergraduates, and the teaching of non-science majors well below scholarship and faculty evaluation (Fairweather, 1993).
This article explores the challenges of and opportunities for teaching science to non-science majors in the context of a liberal arts education. My examples are often from astronomy, a core subject of the classical quadrivium for more than eight hundred years. Astronomy epitomizes the rationale for liberal arts: although to many it may seem useless, astronomy can in fact be used to teach critical thinking skills that are applicable across the curriculum. It also has singular features: much of the best research data are readily accessible in the public domain (images and other data from the Hubble Space Telescope are the most notable examples; more generally, the night sky belongs to everyone). In addition, whereas amateur scientists are rare or nonexistent in most fields, astronomy has innumerable active amateurs. Finally, people are familiar with the topic, which makes it accessible and nonthreatening to novice learners. However, this final benefit is offset by the fact that in popular culture, the image of astronomy is sometimes muddied by UFO “sightings” or confused with astrology. All the teaching methods discussed in this essay can be effectively used in large classes (100 to 150 students) of non-science majors with minimal additional teaching support.
SCIENCE EDUCATION IN PRINCIPLE
What Every Student Should Know
The best way to engage a group of scientists in a debate on education is to start with the question of what every student should know. They all will have an opinion—often forcefully stated—and will offer up a list of essential topics in their specific discipline. The lists will have a common core of mutual agreement, along with idiosyncratic and individualistic selections. Most of the heat —and little light—will come from arguments over the non-overlapping elements.
Professional astronomers form a small scientific community of about 7,000 people in the United States and twice that number worldwide. The American Institute of Physics (2009) tabulates seventy-five institutions granting astronomy Ph.D.s, and those physics and astronomy departments have roughly 1,700 faculty members between them. Most astronomy faculty teach introductory astronomy for non-science majors. The total enrollment in such courses is about 250,000 per year, which includes 150,000 students enrolled in four-year colleges with astronomy, physics, or combined physics/astronomy departments, and 100,000 students in two-year schools, most of which are community colleges or two-year colleges with neither physics nor astronomy departments (Fraknoi, 2004). Educational leaders and teaching specialists from the community of departments offering astronomy courses gathered in the early 2000s for two workshops to answer the question, what are the goals for the teaching of Astro 101?
Although each workshop group had no knowledge of the other’s discussions, their answers were remarkably similar (Partridge & Greenstein, 2004). They agreed that the goals for teaching Astro 101 should be for students to gain:
- A cosmic perspective—a broad understanding of the nature, scope, and evolution of the universe and where Earth and the solar system fit into the larger picture;
- An understanding of a limited number of key astronomical quantities, as well as some knowledge of appropriate physical laws;
- An understanding of the notions that physical laws and processes are universal, that the world is knowable, and that humans come to know the world through observations, experiments, and theories (the nature of progress in science);
- Exposure to the types, degrees, and roles of uncertainty in science;
- An understanding of the evolution of physical systems and some knowledge of related topics such as gravity and the formation of spectra, as well as a set of useful tools from related subjects such as math, chemistry, geology, and biology;
- An acquaintance with the history of astronomy and the evolution of scientific ideas, or science as a cultural process; and
- Familiarity with the night sky and how its appearance changes with time and with one’s position on Earth’s surface.
What is striking about these goals is their lack of specificity regarding content. The workshop groups did not design a curriculum or propose detailed standards. Several of their goals make only passing reference to astronomy and with the change of a few words could apply equally to physics or to a much less closely related discipline. Astronomy educators implicitly recognize that their audience has no long-term commitment to the subject: most of their students are satisfying a science requirement as part of a general education program. The goals agreed upon at the two workshops recognize that the most valuable approach to teaching astronomy is to teach broad content that applies across all scientific disciplines. The philosophy seems to be “less is more.”
The workshop groups also set goals for the skills, attitudes, and values students should take away from an introductory astronomy course. They agreed that students should:
- Be exposed to the excitement of actually doing science, the evolution of ideas in science, and science’s cultural backdrop;
- Receive training in the method of science, in particular the role of observations and experiments, analysis of evidence and hypotheses, critical thinking (including appropriate skepticism), hypothesis-testing (including experimental design and following the implications of a model), quantitative reasoning and the ability to make estimates, the role of uncertainty and error in science, and how to make and use spatial and geometric models; and
- Be left more confident in their own critical faculties, inspired by and about science in general and astronomy in particular, and interested in and better equipped to follow scientific arguments in the press and the media.
These goals are pan-scientific and make almost no reference to astronomy. They are as ambitious as they are overarching, and they set a high bar for teaching students who arrive poorly prepared in science, often with habits of mind ill-suited for grappling with unfamiliar subject matter and applying logic to the world around them.
Throw the Book at Them
The most important resource for teaching non-science majors has been the textbook. In astronomy, as in all other scientific subjects, textbooks have become overstuffed behemoths scrambling to track the increase in knowledge.
A survey of introductory astronomy textbooks in 2007 found two dozen titles, involving three dozen authors, serving a market of about 250,000 students per year (Bruning, 2007). A typical astronomy textbook is 600 pages long, costs $100, and includes a glossary with 500 terms. Average length and cost have increased steadily over the past few decades, with cost rising much faster than inflation (see Figure 1; Bureau of Labor Statistics, 2005).
Figure 1: The Increasing Cost of Textbooks and Tuition Relative to General Consumer Prices, 1986 to 2004
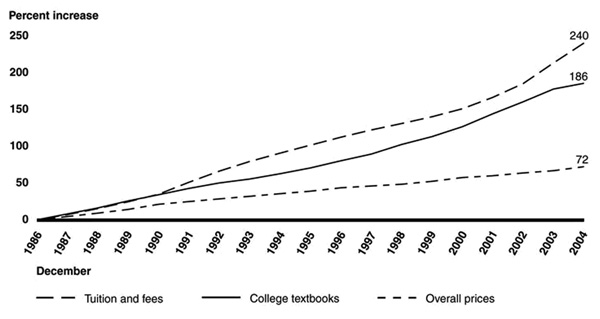
Educators are concerned about the increased cost of education, but the rapidly rising cost of science textbooks is causing students not to buy them even when they are required, to the detriment of their learning. Source: Bureau of Labor Statistics. 2005. College Textbooks: Enhanced Offerings Appear to Drive Recent Price Increases. GAO-05-806. Washington, D.C.: Government Accountability Office.
However, the most significant limitations of textbooks as pedagogical tools are not size and cost, but the traditional and conservative way they are written and compiled. This conservatism derives not from publishers’ unwillingness to include exotic and esoteric phenomena such as superstrings, gravity waves, and alien civilizations, but from their strictly “kitchen sink” approach to the content and their inability to structure books so the processes or general attributes of science have equal footing with the facts. In fairness to the authors and publishers of these books (I was one of the former for about a decade, so I know the business from three sides: as a teacher, an author, and the parent of two students using textbooks), market forces push books to become larger, to include all recent advances, and to become more similar as they copy each other’s features and innovations. Publishers are moving in the direction of vertical integration, where a textbook is part of a teaching “system” that also incorporates a website, interactive tutorials and applications, and testing materials.
Student dissatisfaction with the price of textbooks and the lack of cheaper alternatives is strong and growing. A coalition of public interest research groups (PIRGs) and student government associations has captured the attention of legislatures in several dozen states (Ripoff 101, 2005). Following a U.S. Government Accountability Office report finding that prices of textbooks had tripled between 1986 and 2004 and estimating annual expenditures of $1,000 on textbooks, Congress passed a bill in 2008 requiring publishers to release more information on prices and prohibiting the practice of selling only new books bundled with software, CDs, and workbooks. In the PIRG study, two-thirds of faculty said they never used the bundled items, and three-quarters said that frequent new editions were largely unjustified.
Malaise in the textbook industry affects science education directly. High prices mean that one in four students does not buy the required textbook, and that percentage is increasing. When students buy, lease, or rent used or old books, they may forgo the latest information in fast-changing fields. In 2006, the National Academy of Science sponsored a workshop on “Reconsidering the Textbook,” convening NSF and academic leaders to survey textbooks and analyze their relation to the growing set of electronic tools available for learning. The participants acknowledged signs of evolution from static printed pages of content to a more dynamic, interactive medium but were unsure whether traditional media producers could make the “jump to hyperspace.” Since then, electronic publishers have taken advantage of the increasing capabilities of handheld devices (Butler, 2009).
Meanwhile, the habits of college-age students are rapidly changing with the ubiquity of computers and high-speed Internet. A study by the Pew Research Center’s Internet and American Life Project found that the Internet has eclipsed television, print media, and libraries as the primary source of science news and information (Horrigan, 2006). Nearly 90 percent of online users research science information using the Internet. Depending on topic, the Internet is used more frequently than any other information source by a factor of two to six. The Pew report is a gold mine of information on the way the public now gets its information and has great relevance for the strategies of science educators (see Figure 2).
Figure 2: Understanding of Science—Comparing College Graduates Who Get Science Information Online to College Graduates Who Do Not
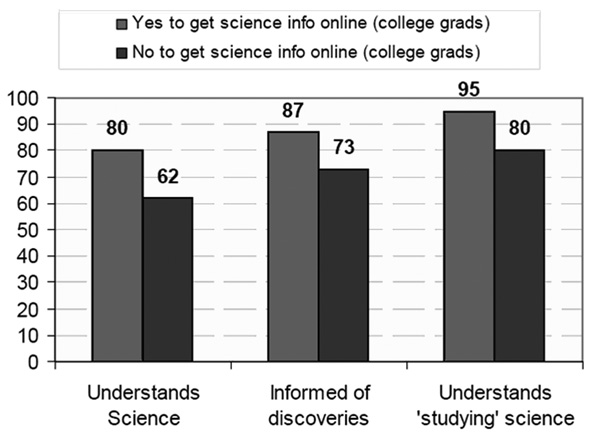
This graph shows that use of the Internet as a source of science news and information corresponds to high levels of science understanding, after controlling for different levels of education and interest. Measures of understanding the content and the method of science are based on NSF metrics. Because of the large sample size, the differences between “yes” and “no” responses for each of the categories are highly significant. Source: Horrigan, J. B. 2006. The Internet as a Resource for News and Information about Science. Washington, D.C.: Pew Internet and American Life Project. http://www.pewinternet.org/Reports/2006/The-Internet-as-a-Resource-for-News -and-Information-about-Science.aspx. 14.
For example, the study reveals that people choose the Internet to get science information purely on the basis of convenience, as opposed to any perception of high accuracy. The Internet boosts general science awareness; two-thirds of all users say they come across science news and information when they go online with another purpose in mind. Eighty percent of those who get science information online use another resource to check those facts, although most simply use another online resource for fact-checking. The Internet is becoming a hermetic world of information, which increases the pressure on science educators to train their students in how to evaluate the credibility of online resources. At the moment, few universities have widely available or mandatory classes on information literacy.
An Electronic Cornucopia
With four million articles in English and an open editing framework, Wikipedia continues to grow rapidly and now dwarfs all other information resources online or in print. A third of all adult Americans who go online use Wikipedia as a reference, and on a typical day one in ten online users consults it. Wikipedia is routinely among the ten most-visited websites (Rainie & Tancer, 2007). The average Wikipedia user is younger, richer, and more highly educated than the average Internet user. Academic debates over whether students should use it are essentially moot; for college-age people Wikipedia has rapidly become a one-stop shop for all forms of information. The more relevant questions are “How accurate is its science content?” and “How can it be improved?”
Scientists and educators are understandably dubious of the reliability of a resource that can be anonymously edited by anyone. However, when Nature commissioned a head-to-head comparison between Wikipedia and Encyclopedia Britannica, the result was almost a draw (Giles, 2005). Among forty-two articles on science topics, four serious errors were found in each resource, and a typical article had four minor errors in Wikipedia and three in Encyclopedia Britannica. Since then, smaller studies by a variety of bloggers and commentators confirm the general absence of major errors in Wikipedia science articles, although the writing quality is uneven. One study found that Wikipedia was more accurate and usable on a particular topic than a National Aeronautics and Space Administration (NASA) website devoted to the topic (see Figure 3). The Wikipedia Foundation has taken steps to improve reliability by identifying a cadre of expert editors whose edits cannot be undone or overridden by anyone else. I have read more than a hundred articles on astronomy and astrophysics and agree that howlers are rare; the quality and level of detail often are surprisingly good.
Figure 3: Usability of Wikipedia Relative to NASA’s Website for Information on Apollo
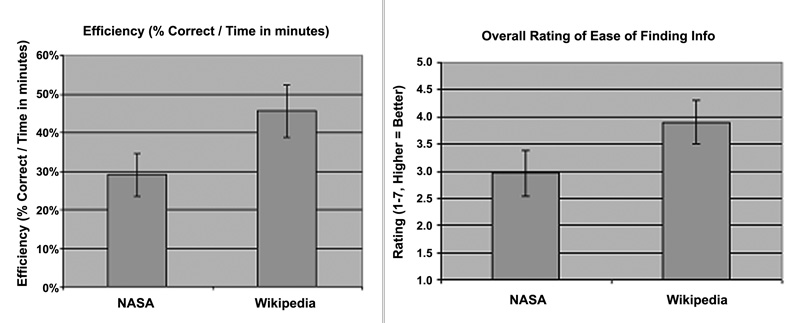
In a head-to-head usability study that asked 130 people to answer nine questions about the Apollo program, Wikipedia scored better than NASA’s website in almost every aspect: task accuracy, time, efficiency, and ease of finding information. The left-hand graph shows the percentage of items that were answered correctly normalized by the amount of time taken. Overall, the scientific content of Wikipedia is accurate and comprehensive. Source: Tullis, T. 2008. Results of online usability study of Apollo program websites. Measuring User Experience. http://www.measuringuserexperience.com/Apollo/. Graphs courtesy of Tom Tullis.
Wikipedia has benefited synergistically from the power of search engines, particularly Google. Over 70 percent of Wikipedia’s traffic comes from search engines, half of it from Google. Wikipedia’s high density of internal and external links guarantees its pages high ranking in Google’s page-rank algorithm; most searches on academic topics return Wikipedia pages in the top three results. Google is also the most frequent downstream destination for users of Wikipedia, completing the cycle. The best strategy for scientists may be to accept the inevitable—the future of information is computers and networks, electrons and waves, not paper and ink—and improve the resource by reading Wikipedia articles in the topics of their expertise, editing them where they find mistakes, and developing test cases to train their students on how to skeptically evaluate the quality of online content.
The information revolution is really just beginning. Tools for navigating and organizing digital information have not been able to stay ahead of the rising tide, so finding the useful information and reliable knowledge in that ocean of bits is a challenge. In 2010, roughly 1019 bits, a staggering 1,000 exabytes, will be added to the digital universe (Gantz et al., 2007). That amount of data would fill enough books to line a bookshelf stretching from the sun to twice Pluto’s distance, or thirty-six tons of books for every person on Earth.
A wealth of scientific information also exists that is not currently visible to any Web surfer. In June 2008, Google passed a milestone when it indexed its trillionth Web page. However, the crawlable Web is just the tip of an iceberg of information contained on computers and in databases that Google cannot see (Bergman, 2001). The “deep Web” is several orders of magnitude larger and contains a large amount of data relevant to science education. Examples include over 500 terabytes of data in the National Climate Data Center of the National Oceanic and Atmospheric Administration (NOAA) and 50 terabytes in NASA’s High Energy Astrophysics archive. University librarians have taken an important step toward harnessing this hidden information with INFOMINE (http://infomine.ucr.edu), a virtual library that organizes Internet resources across academic disciplines. A different approach is taken by the creators of the Wayback Machine (http://www.archive.org/web/web.php), a nonprofit initiative to archive the history of the Web, currently with more than 150 billion pages stored.
Learning on the Web will improve if software engineers can solve another great challenge: building “semantic” search tools. Google has achieved revenue of over $20 billion a year based on simple keyword search, and many major players on the Web still use human labor to answer general questions. No technology yet exists to answer a question posed in natural language, although Wolfram|Alpha (http://www.wolframalpha.com) and Microsoft’s Bing (http://www.bing.com) are steps along that road. The ability to perform robust semantic searches will greatly increase the power of the Internet as a learning tool.
Lifelong Science Literacy
In the Age of Science, what could be more natural than desiring that students in our classrooms gain some level of science literacy? Most scientists agree that people not destined for scientific or technical careers nevertheless should be familiar with the results and the process of science. All twenty-first-century citizens require a sufficient vocabulary, a basic knowledge of general concepts, and an understanding of the scientific method to better comprehend the world in which we live and to make sound decisions about scientific issues.
Beyond that broad and uncontroversial initial statement, however, are variations in philosophy that map to different strategies for teaching. One such variation might be called the argument from liberal arts, according to which business majors, for example, should study chemistry or physics to enable them to see reasoning and analytic skills applied outside their chosen field and to become familiar with the context for all knowledge (for an extreme example of this position, see Kitao, 1999). The argument from the standpoint of comprehension stresses that anyone should be able to understand the terms and concepts in a science article printed in a general newspaper or magazine (Hazen & Trefil, 1991). The argument from civics asserts that in a world increasingly influenced by science and technology, an informed citizenry is needed to guide the formulation of public policy (Miller, 2004). A minority viewpoint declares that all students should know from direct experience—practice—how scientists ask questions of nature, even if the students will not use this knowledge in their subsequent careers (O’Neil & Polman, 2004). Finally, a few contrarian experts consider the goal of broad scientific literacy to be unrealistic and ill formed (Shamos, 1995).
Surveys of the public’s understanding of science, conducted over the past two decades, have framed the issue of scientific literacy and should give most scientists cause for alarm. A recent Harris Interactive poll for the California Academy of Sciences (2009) found that only one in two adults knew how long it took for Earth to go around the sun, fewer than two in three adults knew that the earliest humans and dinosaurs did not coexist, and only one in two could approximate the percentage of Earth’s surface that is covered with water. Just one in five got all three questions right. These questions are a subset of a larger set of questions from a longitudinal study of American adults conducted by the NSF on behalf of the National Science Board (see Figure 4; NSB,2010, and references to previous volumes therein). Based on three criteria— giving a sufficient answer to the open-ended question on what it means to study something scientifically, recognizing that astrology is not scientific, and correctly answering six or more out of nine science content questions—just 25 percent of the public is considered to be scientifically literate.
Figure 4: Performance of University of Arizona Undergraduates on a National Science Foundation (NSF) Science Literacy Questionnaire
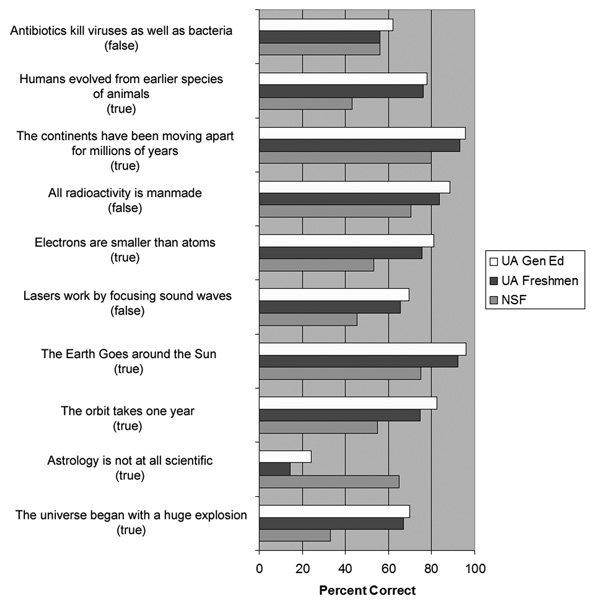
Responses to a series of statements on biology, geology, physics, and astronomy administered to the general public in a phone survey conducted by the NSF and in a questionnaire administered to both first-year students at the University of Arizona (UA) who had not taken any college-level science courses and UA students (typically juniors and seniors) enrolled in general education science classes. The samples sizes are 1,864 for NSF, 1,275 for UA first-year students, and 828 for UA general education students. Data are from 2006 for NSF and 2004 to 2008 for UA. The anomalous result on astrology—the low performance of the college-age cohort compared with the general public—seems real because responses to a Likert-scale measurement from the same overall survey instrument (a five-choice scale from strongly agree to strongly disagree) are consistent. Source: National Science Board. 2008. Science and Engineering Indicators. Arlington, Va.: National Science Foundation.
This statistic raises a series of questions, most of which do not have neat or even agreed-upon answers. How should science literacy be defined? What level of performance is considered adequate, and how is it justified? What is the functional utility of science literacy, and how is it evaluated? What is the trade-off between breadth and depth, either in terms of coverage of the science disciplines or topics within a discipline? Are some facts or concepts so central that everyone should know them? In what follows, I avoid these questions. Scientists do not occupy particularly high ground in the debate over scientific literacy because they tend to be quite uninformed in specialties beyond their own (Collins & Evans, 2007). The lack of breadth in the science knowledge of scientists casts an interesting light on the definition of scientific literacy for non-scientists.
In the NSF biennial surveys of the public understanding of and attitude toward science and technology (NSB, 2010), educational achievement and, in particular, the number of college science courses taken are the strongest redictors of civic scientific literacy (Miller, 2004). The NSF findings invite consideration of whether existing science requirements in general education programs are providing the college-age population the societal benefits hoped for by educators and scientists. (About 10 percent of undergraduates in the
SCIENCE AND THE EDUCATED AMERICAN
United States take a general education astronomy course during their undergraduate career [Fraknoi, 2001].) For twenty years I have conducted a continuing study of scientific literacy at the University of Arizona. Nearly ten thousand undergraduates enrolled in science classes have been asked science content questions that overlap with those used in the NSF’s Science and Engineering Indicators series (see http://www.nsf.gov/statistics/indicators). Data for my study are just beginning to be published (Impey et al., 2010), but several of the initial findings are intriguing:
- Scientific literacy among entering freshmen is only marginally higher than that of the general public, with the exception of larger differences in knowledge of evolution and the Big Bang. Gains in knowledge on any particular item by graduation are only 10 to 15 percent, despite the fact that students have taken two or three science courses (see Figure 4).
- There is a small but highly significant gender effect in favor of better performance by men on the scientific knowledge questions. The study has not detected any improvement in scientific literacy for either men or women over twenty years, while the gender gap has persisted.
- Of students who have completed their science requirements, one in three believes that antibiotics kill viruses as well as bacteria; one in four thinks lasers work by focusing sound waves; and one in five thinks atoms are smaller than electrons and is unaware that humans evolved from earlier species of animals and that Earth takes a year to go around the sun.
- Only one in five undergraduates says that astrology is “not at all” scientific, though that fraction increases from 17 percent to 34 percent as students move through the university. Equally worrying, half of all science majors say that astrology is “sort of” or “very” scientific (see Figure 5).
- Education majors—the cohort of future teachers—perform worse than average on almost all the individual questions and in terms of their overall scientific literacy.
- General education teaching for non-science majors has been credited with impressive gains in public science literacy over the past twenty years (Miller, 2004). The University of Arizona data do not support that hypothesis. Most people seem to gain what basic scientific knowledge they have during high school. Subsequent college classes may be ineffectual in improving science literacy much beyond the level of a high school graduate for reasons that are unclear, but there are several possibilities. One is that the science knowledge students gain in high school is fragmentary and may barely prepare them for college-level science classes. Another is that college-level science courses lack a comprehensive science syllabus, and the result is substantial gaps in student knowledge. A third explanation may be that science courses are taught with ineffective teaching methods.
- In sum—and if the University of Arizona undergraduate population is typical of most large public research universities— students graduate with substantial gaps in their scientific knowledge. Our instruction is not raising students to the level we would expect for educated citizens who must vote or express their opinions on many issues that relate to science and technology.
Figure 5: Systematic Trends on Undergraduate Responses to Statements about Antibiotics and Astrology
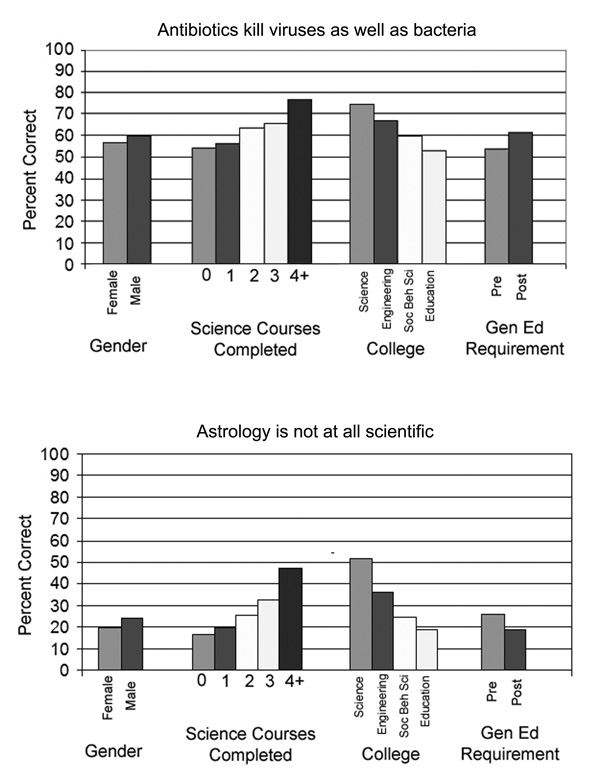
The analysis of 9,200 true/false reactions to a statement about antibiotics and 6,300 true/false reactions to a statement about astrology shows a small but statistically significant gender effect. The percentage of students who correctly answer each question increases with the number of science courses taken, although the improvement is greater (and starts from a lower base) with the astrology question. Most students who have taken four or more science courses are science majors. The distinction between pre- and post-general education requirement connotes students who have taken less than two and two or more science classes, respectively. Among majors in the colleges of science, engineering, social and behavioral sciences, and education, those students preparing to be teachers perform the poorest. Source: Impey et al. 2010. A twenty year survey of science literacy among college undergraduates. Journal of College Science Teaching.
Knowledge is one part of the terrain of science literacy; beliefs and attitudes are another. Students (and people in general) often hold mutually conflicting beliefs. As long as they are not faced with a situation where the tension must be resolved, there is no problem. The second part of my twenty-year, ongoing study at the University of Arizona requires undergraduates to respond to twenty-four statements about science and technology on a five-item Likert scale, with choices ranging from “strongly agree” to “strongly disagree.” Students are generally well disposed to technical endeavors; for example, 93 percent agree or strongly agree with the statement, “Overall, the progress of science and technology has been beneficial to our civilization.”
However, students’ responses to statements about the limitations of science and examples of pseudoscience are illuminating (see Figure 6). Undergraduates do not view science as all-encompassing in its explanations: 80 percent agree or strongly agree with the statement “There are phenomena that physical science and the laws of nature cannot explain.” Without further interrogation, one cannot tell whether the students in their responses are alluding to phenomena that science cannot explain even in principle (in which case they are not rationalists) or phenomena such as dark energy or the mind-brainproblem that science has not yet successfully explained (in which case they have a realistic sense of science’s current boundaries). In addition, 40 percent believe the positions of the planets affect everyday life, the same percentage think some people have psychic powers, one in six believes that aliens visited ancient civilizations, one in four thinks faith healing is a legitimate alternative to conventional medicine, and a quarter think that some numbers are lucky for some people (whether the rest think that some numbers are unlucky is not clear).
Figure 6: Responses from Nearly Ten Thousand Undergraduates to Statements about Pseudoscience
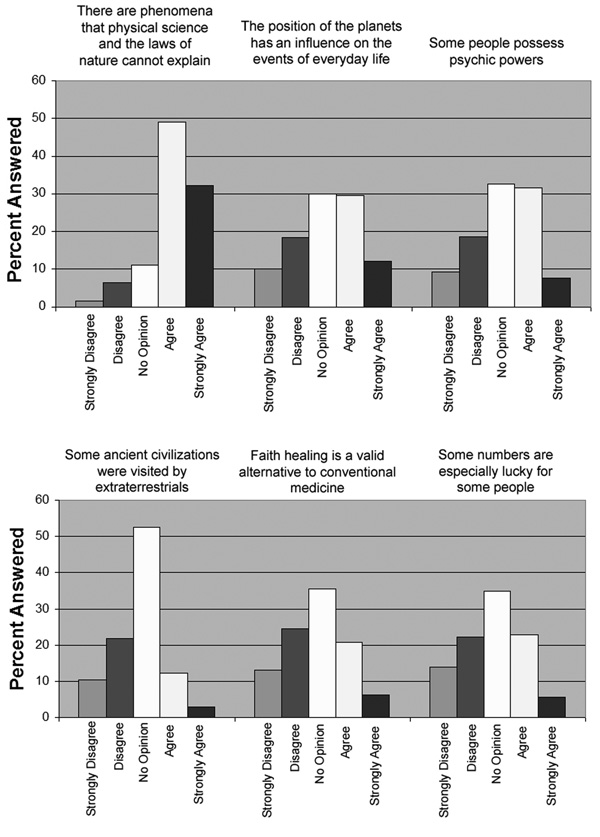
Overall responses by nearly ten thousand undergraduates over twenty years to six statements about pseudoscience and nonscientific beliefs. These beliefs coexist with solid performance when answering the questions in the science knowledge portion of the survey. Source: Impey et al. 2010. A twenty year survey of science literacy among college undergraduates. Journal of College Science Teaching.
This unparalleled data set will be used for a comprehensive study of science knowledge and beliefs among undergraduates. The study will use overlapping NSF questions to bring in the general population and will use the demographics of the University of Arizona’s student body to bring in twenty-one million college students nationwide. The modest gains in scientific literacy that seem to accrue from college science classes suggest our pedagogy has room for improvement. Moreover, undergraduate susceptibility to pseudoscientific beliefs leaves these young people open to charlatans and scams of many kinds. A general education course in skepticism would be a useful addition to the curriculum at my university and probably at many others.
How People Learn
A review of the vast literature from neuroscientists and behavioral psychologists on how people learn is beyond the scope of this paper. The science instructor can most usefully assimilate that information from a number of collections that take the research and apply it to the classroom. Two notable volumes published by the National Academies Press (Bransford, Brown & Cocking, 2000; Donovan & Bransford, 2005) emphasize three key findings:
- Students are not blank canvases on which we paint knowledge. They come to the classroom with preconceptions about how the natural world works. If their prior understanding is not properly diagnosed and engaged, they may fail to learn new information and concepts, or they may revert to their prior understanding outside the classroom.
- To develop competence in a scientific subject, students need facts that fit into a conceptual framework, and they need to organize those facts themselves in a way that facilitates retrieval and application.
- Research favors a metacognitive approach, or explicit recognition by students of how they learn. Students who are aware of how they learn will be more engaged because they can set learning goals and monitor their own progress.
Ignorance is sometimes bliss, because knowing these findings raises the bar on how we teach. We have to work with the preconceived notions students bring into the classroom (in fact, the word education alludes to this reality: its root is the Latin word for “drawing out” something potential or latent). We must not only teach students facts but also provide multiple contexts for developing their understanding of those facts. We should determine how to inject the teaching of metacognitive skills into the curriculum; use the tools and technology of the classroom to center on the learner more than the instructor; use assessment to guide the choice of pedagogy; and balance the “lenses” of instruction, including the fact that students learn in multiple communities: the classroom, their department, their future profession, and friends and family.
The three principal conceptual frameworks for learning are behaviorism, cognitivism, and constructivism. Let us imagine (or at least hope) we have progressed beyond the radical behaviorism formulated by psychologist B. F. Skinner. Even though molding classroom behavior and meshing student effort with grading schemes involve more than a hint of operant conditioning, the classroom is much richer than a large Skinner box. Cognitivism arrived in the 1930s with an assumption that prior knowledge plays an important role in learning, and cognitivists use memory models to understand the role of “chunking” and cognitive load in classroom settings (Sweller, 1994). Constructivism began with developmental psychologist Jean Piaget and has propelled many waves of education reform. The many hues of this philosophy are united by an emphasis on the student’s free exploration within a pedagogical framework, whereby a professor moves from being the “sage on the stage” to being the “guide on the side.” This approach in its purest form has attracted some criticism (Mayer, 2004).
Figure 7 shows how these three theories map onto pedagogy and instructional media. The “continuum” of instructional technology displayed along the top is developed in more detail with the ways media are used in the classroom on the lower part of the diagram. The pedagogical principles implied by the three theories and the ways they apply to learning are shown in the top part of the diagram. Moving from left to right, each theory corresponds to a greater degree of autonomy and engagement of the learner and higher degrees of adaptability and flexibility for the instructor. Modern education theory strongly favors constructivist approaches.
Figure 7: Different Conceptual Models of Learning and Their Media and Technology Counterparts
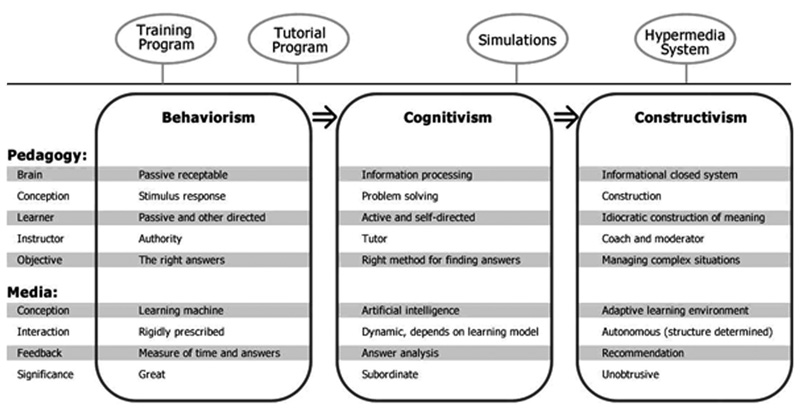
The principal theories of learning all make different assumptions about how the brain processes and retains information, and each posits a different role for the instructor. Teaching technologies are available that map to each of the conceptual frameworks. Source: Figure created and provided by author.
A popular instructional model based on constructivism is called the “Five E’s.” It can be used at all ages, from young child to adult. In practice, the first two stages are often merged.
- Students engage a topic by making connections between present and past learning experiences. For example, in a lesson on the cause of the seasons, students might work in pairs to compare how each of their experiences relate to the seasonal cycle, such as how the cycle relates to their observations of the variation in the highest elevation of the sun in the sky. They can also compare what they know about Earth’s orbit and its distance from the sun.
- In the explore phase, students develop concepts from a common base of experiences. Students might use a collimated light beam to observe how intensity varied with distance from the light source or angle of the radiation. Exploration can be open-ended but is more often guided.
- The explain phase allows teachers to introduce formal terms and explanations and permits students to verbalize their conceptual understanding. Thus, the instructor might present the inverse square law and the way light intensity on an area changes as the arrival angle varies. Students would then explain how these concepts relate to their earlier exploration of light intensity.
- The elaborate phase helps extend student understanding and allows them to apply their skills. The instructor might remind students that seasons are opposite in the northern and southern hemispheres, which creates a tension with the idea that seasons are caused by the varying Earth-sun distance. The students’ challenge is to see how that information relates to the two ways light intensity can vary.
- As students evaluate the issue they have been given, they assess their own understanding. For seasons, they might decide whether the variations in Earth-sun distance are sufficient to cause seasonal variations on Earth. In doing so, they confront one of the most omnipresent misconceptions in astronomy.
Cognition research may one day underpin our understanding of how people learn, with consequences for teaching strategies. But cognitive science is still a new academic field, with the first Ph.D. awarded in 1991 (Thagard, 2005). The last few decades have seen progress in neuroscience and computational theory, although some philosophers have questioned the supposition that human brains work solely by representation and computation. One of the most mature theories, Adaptive Control of Thought-Rational (ACT-R), is a symbolic framework that divides knowledge into declarative and procedural representations, which can be coded and implemented using a computer programming language (LISP) interpreter. Carnegie Learning’s Cognitive Tutor software incorporates LISP and is currently used to teach math in thousands of schools across the United States (Anderson & Lebiere, 1988; Anderson & Schunn, 2000).
SCIENCE EDUCATION IN PRACTICE
The traditional large lecture class is poorly suited to the goals of the science course: to transfer long-term knowledge to students, convey a general sense of how science works, and influence their worldview. Some of the structural problems that inhibit the widespread adoption of good principles of teaching and learning are particular to the sciences. Faculty in research-intensive units may experience a reward structure that favors research over teaching, or institutions may place little emphasis on mentoring for teaching. Faculty members in a small department are likely to have high teaching loads, increased contact hours, and slender financial support. In most settings, few faculty members are up to date on best pedagogical practices.
The graying professoriate has a growing disconnect with the technology and computer habits of its undergraduates. In most large lecture classes, professors have limited support (one graduate teaching assistant for a class of one hundred or more is not uncommon) and limited opportunity to break the class into small groups. How do we engage students and encourage learning in these conditions? One can easily become discouraged, but renewed national attention to the problem is cause for optimism. For example, the Reinvention Center at SUNY Stony Brook was founded with a goal of promoting and furthering the recommendations of the Boyer Commission (Boyer, 1998). Those recommendations propose that research universities:
- Make research-based learning the standard;
- Have an inquiry-based freshman year;
- Build on the freshman foundation;
- Remove barriers to interdisciplinary education;
- Explicitly link communication skills and course work;
- Creatively use information technology;
- Have a capstone experience;
- Educate graduate students as apprentice teachers;
- Change the faculty reward system; and
- Cultivate a greater sense of community on campus.
Instructors can draw on many tried-and-tested tools and strategies, such as think-pair-share questions, lecture tutorials, polling about misconceptions, and peer-led debates (Bain, 2004; Davis, 1993).
Learner-Centered Teaching
Professor-centric lectures, no matter how well crafted and how entertaining, can go only so far in helping students learn (Bridges & Desmond, 2000). A body of research published thirty years ago shows that even motivated adult learners have an attention span of no better than fifteen to twenty minutes (Johnson & Percival, 1976). Today’s multitasking, hyperkinetic cyberyouth are even less inclined to sit and listen to a lecture. Indeed, the lecture is social technology dating back to the Middle Ages, a time when electronic distractions did not exist (see Figure 8). On the other hand, people routinely watch a movie that lasts two hours or more while following the plot and with minimal lapses of attention, suggesting that a strong narrative, emotional engagement, and variation of sensory input are the keys to sustained attention.
Figure 8: Schematic Summary of Student Attention Level in Lectures
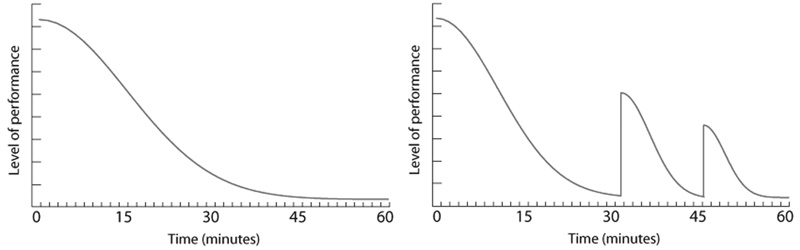
These two graphs measure students’ relative level of performance as the fraction of students paying attention at any time as determined by twelve lecturers over an average of ninety lectures. The level of attention and performance during any lecture shows an almost immediate decline, and at the end of a class period of normal length (sixty minutes) attention is down to a very low level (left-hand graph). Interrupting the lecture for activities, quizzes, or asides helps (right-hand graph), but engagement never returns to what it was at the start of the class. Source: A schematic representation of the conclusions drawn by Johnson, A. H., and F. Percival. 1976. Attention breaks in lectures. Education in Chemistry 13:49–50.
If that is not convincing, then consider this striking example from physicist Carl Weiman of the University of British Columbia; he pioneered education reform while at the University of Colorado. In an introductory physics class for non-science majors, he gave a cogent mini-lecture on the physics of sound and then brandished a violin. He explained that the strings do not move enough air to create the sound from the violin. Rather, the strings cause the back of the violin to move via the sound post, and thus it is the back of the violin that actually produces the sound. Fifteen minutes later he asked a multiple-choice question about where the sounds from a violin came from, and only 10 percent said the back; almost everyone else said the strings. This low level of retention of a counterintuitive fact after only fifteen minutes also applies to faculty and graduate students. Does this mean that all lecturing is bad? No, but it means that lectures have to be carefully designed with principles of cognition in mind (Schwartz & Bransford, 1998).
The most effective courses are learner-centered courses in which learning goals are clearly stated and are commensurate with methods of evaluation (Dancy & Beichner, 2002); interactive techniques are used to continually engage students; and assessment is used to tune the strategies to the particular context of each course, each professor, and each set of students (Angelo & Cross, 1993; Hake, 1998). “One size fits all” has no place in learner-centered education.
Most professors are familiar with the unspoken pact that can develop in the classroom. The professor agrees to deliver a highly structured presentation, not to ask students to think outside the box, and to evaluate them according to the material in the textbook with objective tests, usually multiple choice. In return, the students agree not to be disruptive, to act as tidy receptacles for information, and to regurgitate that information when it is time for a test. All of this is implicit. As long as nobody questions the premise, and the grades connect to the content that is being taught, everyone is fairly happy. This description is a caricature, but not by much.
Weiman and Perkins (2005) describe the failure of traditional methods of physics instruction, noting that:
Students receiving traditional instruction master on average less than 30% of the concepts that they did not already know at the start of the class. The result is largely independent of lecturer quality, class size, or institution. . . . After instruction, students, on average, are found to be less expert-like in their thinking than before. They see physics as less connected to the real world, less interesting, and more as something to be memorized without understanding.
Learner-centered techniques challenge faculty to relinquish some authority and control in the classroom. Peer learning shifts the locus of and responsibility for learning toward the student, which is a positive development (Mazur, 1996; Crouch & Mazur, 2001). Unfortunately, the use of innovative teaching techniques can result in lower student evaluations (Emery, Kramer & Tian, 2003) because these methods often require more effort and engagement from students who might be disengaged if they are non-science majors taking a required science class. This disincentive underscores the imperative that both faculty and department heads be committed to the larger goal of improving learning. Once a professor has experienced the exhilaration of a student-run debate or a group activity where the entire classroom is buzzing with animated discussions, he or she will almost never want to go back to that safe place behind the imaginary fourth wall that “boxes in” the lecturer. Remember: the locus of learning depends on the educator but ultimately rests with the students and the work they do.
Student Misconceptions
Even when they are encountering a subject for the first time, students are not blank sheets of paper. Particularly in the sciences, students often hold strong misconceptions:
Students come to the classroom with preconceptions about how the world works. If their initial understanding is not engaged, they may fail to grasp new concepts and information presented in the classroom, or they may learn them for purposes of a test but revert to their preconceptions outside the classroom. (Donovan, Bransford & Pellegrino, 1999)
Sometimes the dissonance is explicit. I have had students tell me they believe in astrology or a six-thousand-year-old Earth, give the answers I want to hear to do well on the quizzes, and no doubt continue with their prior beliefs after the close of the semester.
Some of the most profound misconceptions relate to the way science works, and they affect learning in any discipline. Non-scientists tend not to have a deep understanding of the tentative nature of scientific theories and the important role of assumptions; nor are they fully aware of the limitations imposed by observational errors and finite data. They tend to believe that scientific laws are perfect and absolute and that scientific calculations are error-free and precise. Their reaction if scientists disagree with one another is to question the validity of the entire enterprise. As psychologist James Alcock (2005) has noted, our brains are “belief engines,” constantly processing information from our senses and generating beliefs about the world without any particular regard for what is true or not. This system evolved to ensure not truth, logic, and reason, but survival. That superstition and irrationality abound in the Age of Science is not surprising.
Preconceptions are not the same as misconceptions, though, and therein lies a complication. Children know that it gets hotter as they approach a burner on the stove, they know that a car’s horn sounds louder when the car is approaching, and they know that a car headlight gets brighter when it drives toward them. In each of these situations close means more, and that becomes a strongly held preconception about the way the world works. But this knowledge may not be helpful in a quite different situation. Summer in the northern hemisphere is not hotter because Earth is closer to the sun (see Figure 9), and the brightest stars in the sky are not the hottest. In these cases, suitable knowledge must be constructed in brand new circumstances, and therefore must first address the student’s preexisting basis for physical intuition (Bailey & Slater, 2003; Comins, 2001; Hufnagel, 2002; Novak, 2002).
Figure 9: Concept Map for a Major Misconception about the Cause of Seasons
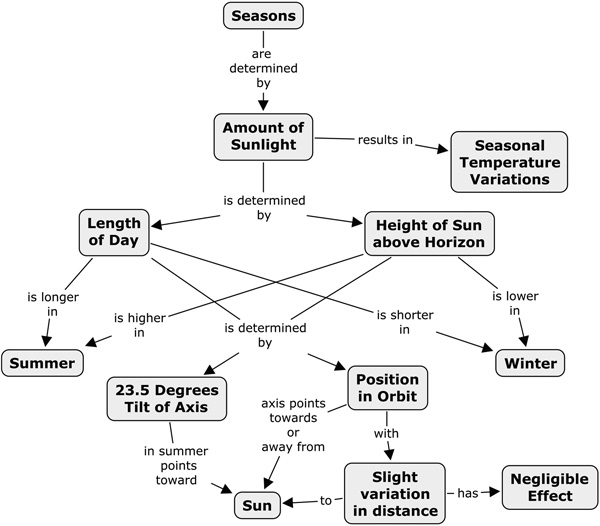
Prior knowledge has to be addressed in teaching because that knowledge tethers to intuition or direct experience even when it is erroneous. In this example, students would have to get direct experience from hands-on activities relating to the amount of sunlight falling on a surface to be able to correct the misconception. Source: Novak, J. D., and A. S. Cañas. 2008. The Theory Underlying Concept Maps and How to Construct and Use Them. Technical Report IHMC CmapTools 2006-01. Pensacola: Florida Institute for Human and Machine Cognition. http://cmap.ihmc.us/Publications/ResearchPapers/TheoryCmaps/TheoryUnderlyingConceptMaps.htm. Figure courtesy of Alberto J. Cañas.
Pedagogical Principles
Even with the temptations for instructors and students to buy into a teaching model based on passivity and regurgitation of information, an abundance of evidence indicates that traditional methods are not working. Students generally find traditional science courses to be boring, irrelevant, and incongruous with the stated goals (Tobias, 1991). Research into learning and cognition confirms that knowledge is associative and thus linked to already-developed conceptions of how the world works, which may be naive and not based on scientific principles (Gabel, 1994). Research also shows that learning is context dependent—what students learn depends on the educational setting—and that students require social interactions to learn deeply and effectively (Clark, 2002; Lazarowitz et al., 2006; Duschl, 2008). Finally, the unavoidable truth is that constructive learning requires mental effort—proper pedagogy can be taxing for both faculty and students!
Teaching may be considered in terms of a progression of four models of pedagogy (see Figure 10). At one extreme is the traditional behaviorist model whereby information flows solely from the instructor and the textbook. Next is the cognitive model, in which students are active participants, often self-directed, and the instructor acts more like a facilitator. A classroom operating this way would have a lot of hands-on labs or experiments, group discussions, and peer instruction. Much of the time is devoted to problem solving. Such a course has structure, but students shape the small-scale learning environment. A Chinese aphorism is relevant: “Tell me and I’ll forget; show me and I’ll remember; involve me and I’ll understand.”
Figure 10: Four Schema for Pedagogy with Different Roles for Student and Instructor
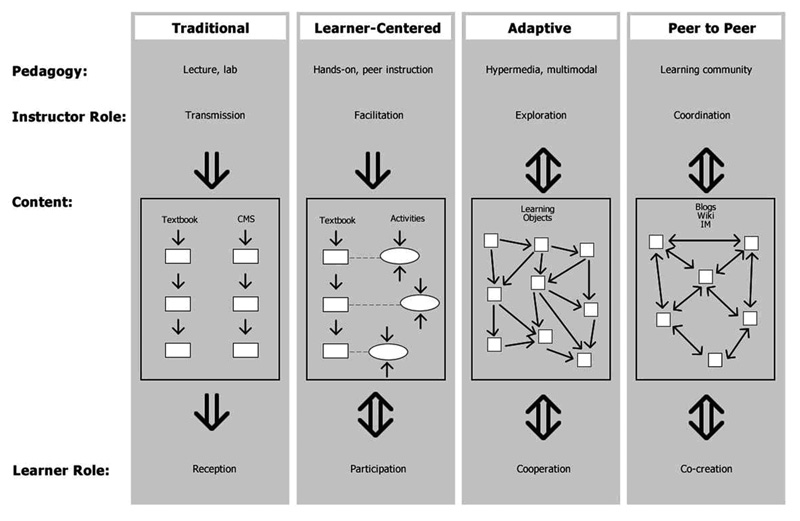
Moving from left to right, the models go from hierarchical to democratic. In the “Traditional” model, CMS is a course management system. The nature and organization of course content mirrors the philosophy of the instruction. Effective teaching avoids pure transmission but can draw judiciously from all the silos. Peer-to-peer models do not remove the authority of the instructor but adapt the progress of the course according to student performance and feedback. Source: Figure created and provided by author.
Higher education has struggled mightily to move between the first and second models of learning; however, two other transitions can be contemplated. The third pedagogical model might be called an adaptive learning environment, whereby the tools of instruction and even the shape of the course are molded by students. The content is made up of reusable learning objects that can be arranged in different sequences, in contrast to the linear flow of a textbook. A reusable learning object is a self-contained chunk of content that occupies two to fifteen minutes of class time, can be delivered in multiple learning contexts— including online—and is tagged with metadata so it can be found in an electronic search (Northrup, 2007). This type of instruction is characterized by active exploration and cooperation, and its basis in learning theory is constructivism. A final step in this direction would be peer-to-peer learning, the extensive use of blogs and wikis, and the creation of learning materials by students working with one another under guidance. The instructor becomes a coordinator and defines goals and standards in this approach. Somewhere between the “fascism” of traditional instruction and the “anarchy” of a pure peer-to-peer environment lies the sweet spot of effective instruction.
Good pedagogy is often a matter of common sense. I wish that when I was starting out as an assistant professor someone had shared the following with me:
- Set the tone of the classroom early. Professors will find that recovering a fruitful learning environment is difficult if chatter, cell phone use, tardiness, and discourtesy take hold in the first few weeks.
- Make the syllabus as thorough and unambiguous as possible. The syllabus is a professor’s contract with the class, and a clear syllabus will prevent many potential problems later on. Students crave structure and transparency.
- Use repetition, with variation and diverse examples.
- Create manageable chunks of information, and never lecture more than ten minutes without interruption.
- Use reinforcement and praise routinely.
- ·Treat students as individuals and engage their diverse learning styles; learn their names if possible. (I can do that in a class of 100, but 150 still defeats me.)
- Remember that a big class is a complex, nonlinear social experiment. Have a plan but be prepared to adapt or alter it at any time. Being the expert and the professor confers authority, but do not be afraid to show passion!
One final tip will be familiar to any parent: avoid sending mixed messages. “Do what I say, not what I do” occurs far too often in classrooms. Professors are modeling professional behavior, and students cannot be expected to be punctual and organized if the professor is not. Students notice when professors claim to be open to questions and discussion but do not allow long enough time for the former and structure class to make the latter difficult. Professors who glance at their watch during class might intend only to judge the timing of the class session so as to cover as much material as possible; students will see the glance as a sign of impatience or desire to be somewhere else.
Perhaps the most disastrous mixed message professors can send is to tell students we want them to understand general principles and how science works while testing them on facts and specifics. Evaluation and pedagogy must be carefully aligned.
Inquiry-Based Methods
In contrast to traditional methods, active engagement and active learning approaches produce significant and long-lasting learning gains (Bybee, 2002; Committee on Undergraduate Science Education, 1997; National Science Teachers Association, 2002). Active learning occurs when students have to take responsibility for their own learning by engaging in critical reasoning about the ideas presented in the class. Some active learning techniques can result in apparent “failure,” but the failures are often informative, and those who do not occasionally fail as a teacher may not be succeeding as well as those who take more risks in order to encourage active learning. To engage students and facilitate critical thinking:
- Ask students questions to frame a discussion. Raise a controversial or topical issue from the news. Use discussions or interactive lecture demonstrations that engage students as participants.
- Give surprise quizzes (they do not need to be graded to be effective). But always screen questions to test higher-order thought processes in the traditional Bloom taxonomy.
- Use personal responders (also called “clickers”) for misconception testing or opinion polling. Note cards or other low-tech methods are equally effective. Involving all students is easy because the polling can be anonymous and the feedback to both students and instructor is immediate (Duncan & Mazur, 2005).
- Assign short, in-class writing assignments. Students could be asked to address the “muddiest point” or summarize the day’s main points. Collect the responses and learn from what the students write. Instead of grading these assignments, award participation points.
- Provide video clips, songs, or references to popular culture to ground material in students’ everyday lives and to engage different learning styles. YouTube is an excellent, ever-growing resource for relevant material.
- Use peer instruction methods such as think-pair-share (Lyman, 1987), where an open-ended question is posed to students working in pairs. Students discuss the question and write down their answers before sharing them with the class. Grading can be based on participation.
- Encourage interactions in small groups of three to four students by using tools such as concept tests and lecture tutorials (Prather et al., 2005). Students gather bits of instruction and then engage the material as a group by responding to one or more questions that focus on common misconceptions (Millis & Cottell, 1998).
- Employ undergraduates as preceptors who take a leadership role by helping with in-class activities and extra-credit events, as well as by assisting other students with their learning in and out of class—a role students can fulfill at most universities for credit or a modest stipend. If preceptors are properly prepared and trained, instructors need not fear that the “blind will be leading the blind,” and because preceptors are close in age to the typical student in the class, they are likely to understand his or her learning difficulties.
- Conduct debates, either between individuals or in student groups. Use role-playing; students can be asked to act as particles, genes, planets, or stars. Whole-class discussions are effective if used judiciously.
- Have students construct “concept maps” that define relationships between all the concepts associated with one topic from the course.
- Use portfolio assessment. Require students to build a suite of written work over the course. Give feedback and interim grades (or at least comments) on each part. Some of the components of the portfolio can be customized to students’ particular interests. A writing-intensive science course carries a higher grading load, but the reward is much deeper insight into what students do and do not know (Danielson & Abrutyn, 1997).
Presented with such a litany of recommendations, any scientist would be forgiven for demanding to be shown the data! In each of the scientific disciplines, education research is a small niche compared to the discipline’s overall research. Studies on teaching and learning in astronomy are inspired by the larger community of physics education. The online peer-reviewed journal Astronomy Education Review was started in 2002 and is currently supported and operated by the American Astronomical Society. A small but growing cadre of Ph.D. scientists is engaged in education research and is beginning to have an impact on teaching practice around the country via workshops, publications, and the dissemination of tools and strategies. The Center for Astronomy Education drives much of this activity.
Gathering reliable data on the efficacy of the methods discussed above is not easy because of the necessity for pre- and post-testing and careful experimental design. Evaluation and assessment tools are also central to this research (and are two topics that are beyond the scope of this review). These obstacles aside, lecture tutorials are one model that has proven to be highly effective in large astronomy classes of one hundred to three hundred students. Lecture tutorials are based on the topics that faculty cover most frequently and require fifteen-minute time chunks that can be easily inserted into a lecture. Designed to elicit misconceptions or naive mental models, they are highly interactive forms of Socratic dialogue. When pre-testing on eight core topics is compared to testing after lecture and testing after lecture tutorials, the lecture tutorials show substantial gains that benefit all students equally (see Figure 11). Improvements over straight lectures are similarly large for lecture tutorials and ranking tasks (Prather et al., 2005; Hudgins et al., 2006).
Figure 11: Learning Gains for Lecture Tutorials and Ranking Tasks
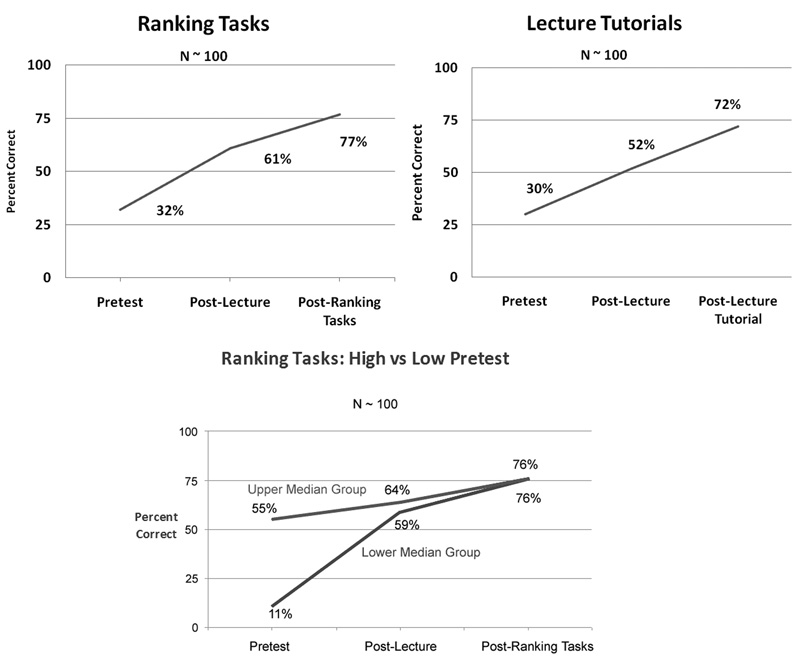
The use of ranking tasks or lecture tutorials in an introductory astronomy class produces gains over lecture, when each is measured with a pre-test and a post-test. Ranking tasks are conceptual exercises in which a student is presented with four to six physical situations, usually in graph or diagram form, and is asked to order them based on some resulting effect. The study found no significant gender effect. The lower graph shows that, for ranking tasks, students in the lowest pre-test group are elevated to the same level as the high pre-test group. Source: Prather, E. E., T. F. Slater, J. P. Adams, and J. M. Bailey. 2004. Research on a lecture-tutorial approach to teaching introductory astronomy for non-science majors. Astronomy Education Review 3(2):122– 137. Hudgins, D. W., E. E. Prather, D. J. Grayson, and D. P. Smits. 2006. Effectiveness of collaborative ranking tasks on student understanding of key astronomy concepts. Astronomy Education Review 5(1):1–22. Graphs courtesy of Edward Prather.
Support for the value of interactive instruction in astronomy is growing (Prather et al., 2008). For a nationwide study, astronomy professor Edward Prather and colleagues chose “light and spectra” because these areas are the most important and commonly taught topics in most introductory astronomy classes. Pre- and post-testing were performed on nearly four thousand students taught by thirty-six instructors at thirty-one two-year and four-year institutions in the United States. Normalized gain scores were measured after testing on the Light and Spectra Concept Inventory (Bardar et al., 2006). Interactivity was measured by the amount of time each class spent outside lecture mode in group work, activities, labs, recitation sections, or one-on-one modes of engagement. Classes with more interaction showed larger gains (see Figure 12).
Figure 12: Learning Gains on Light and Spectra Concepts versus Level of Classroom Interactivity
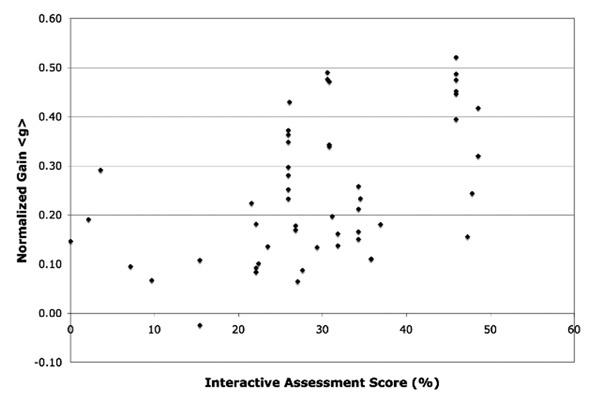
The Light and Spectra Concept Inventory (Bardar et al., 2006) was administered to nearly four thousand students across the country. The normalized gains were mostly between 0.1 and 0.2 for classes with low degrees of student interactivity and nearly three times higher for classes with high degrees of interactivity. The wide range in gains suggests some dependence on instructor and institution. Source: Prather, E. E., A. L. Rudolph, G. Brissenden, and W. M. Schlingman. 2008. A national study assessing the teaching and learning of introductory astronomy, Part I: The effect of interactive instruction. American Journal of Physics 77:320–330. Graph courtesy of Edward Prather.
These materials are now readily available for astronomy teachers, often in conjunction with textbooks. One book of feedback questions and discussion prompts is intended for introductory astronomy courses (Adams, Prather, and Slater, 2004). The same group has collected many strategies for teaching large astronomy classes (Pompea, 2000; Slater and Adams, 2003). Ranking tasks and peer instruction methods have also been documented (Green, 2003).
Even if lectures remain the primary delivery vehicle, they can be easily adapted to include these techniques so that inquiry-based instruction can be introduced incrementally. The advantages of any of these techniques are that student misconceptions are explicitly identified, the instructor is better paced, and students are more engaged with the class. For instance, an interactive demonstration could be preceded by a short quiz with clickers or note cards to identify the most common misconceptions about the topic. Alternately, the class could be asked to write on a card their expectations for an upcoming demonstration. The cards can then be passed around to mix them up, and sample responses can be read out before the demonstration begins.
Simple show-and-tell is highly effective if it makes students think more deeply about the material. In astronomy, an iron meteorite—an example of a messenger from trillions of miles away and billions of years ago whose material was ejected from a star before Earth was born—can be used to spark discussion. In biology, a package of dental floss in a plastic Easter egg can serve as a scale model of the nucleus of a eukaryotic cell and can be used to convey the vast information content of DNA. Pass the egg around the class and unravel the floss: in this enlarged scale model, 5 kilometers of dental floss would equal the length of the unraveled DNA in the nucleus of a human cell. Students could then imagine information written on this flossy “book of life”: a sentence would be the length of a gene, and the smallest unit of information, a base pair, would be a fraction of a millimeter.
Even a simple think-pair-share question can facilitate deep learning if it is contained in a suitably structured activity. Consider this question, which I have used in a sophomore-level astrobiology class: “When a seed grows into a tree, where does most of the mass come from?” Students will animatedly discuss this for as long as I allow. Measured using clickers, initial answers split equally among four responses: water, the air, dirt and soil, and “the mass is already in the seed.” The last choice represents a view of life that predates the Industrial Revolution. Students can easily show that plants are not made of the same chemicals as soil. But even after a mini-lecture on photosynthesis most students are not certain whether the correct answer is water or air, so the debate continues. After a proper accounting of transpiration, they can see that the answer is air, and knowing that the stuff of mighty redwoods is built using carbon snatched from thin air makes a deep and long-lasting impression.
The Role of Technology
Plato was right: the best form of instruction is the Socratic dialogue. Since the time of the ancient Greeks, only two real revolutions have occurred in the delivery of instruction. The first occurred in 1969, at the time of the Apollo moon landings, when overhead projectors began to supplant the traditional blackboard. The second began with the maturation of personal computing and the Internet in the mid-1990s and continues today with a bewildering array of multimedia tools and technologies. Moore’s law—the doubling every two years in the speed and circuit board density of microprocessors—and its analogue in the increase of Internet bandwidth are transforming the economy. Higher education is riding this wave of exponential change.
The so-called Net Generation is able to multitask and expects a high degree of engagement with technology (Oblinger & Oblinger, 2005). However, technology itself does not guarantee good instruction. Too many examples of instructional technology are best categorized as “shovelware,” old content dressed in new clothes without any enhancement in function. Academia has long been trying to come to grips with the best ways to teach students using technology (Brown, 2000; Palloff & Pratt, 2001; Garrison & Anderson, 2003). Most professors are bewildered by the sea change in student habits away from email and TV to texting and online video, and by the wildfire spread of social phenomena like Facebook and Twitter. Signposts are provided annually by Horizon Reports from the New Media Consortium and the EDUCAUSE Learning Initiative (Johnson et al., 2010; see http://wp.nmc.org/horizon2010).
Many companies and individuals have developed resources that can help increase student engagement and learning. Some are associated with prominent textbooks and thus are free to adopters of the books, while others are available on the Web. The best example is the Multimedia Educational Resource for Learning and Online Teaching (MERLOT), an open-access collection of several thousand peer-reviewed and annotated learning resources supported by a large consortium of universities (Cafolla, 2006; see http://www.merlot.org). Activities linked to specific textbooks are often excellent because publishers, who see them as a way to gain comparative advantage in a competitive marketplace, make major investments in applets and interactive tutorials.
Sophisticated Java applets for introductory physics and astronomy courses allow students to behave more or less like real scientists: taking realistic but synthetic data with plausible errors, varying the parameters, and fitting models. Examples include detecting extrasolar planets with Doppler velocity data that include realistic noise and time sampling (Greg Bothun, University of Oregon) and modeling changes in chemical composition of planetary atmospheres and the effect of such changes on climate (Dick McCray, University of Colorado). Greg Corder (2005) has studied the benefits of this technology for science learning.
Existing ideas like concept maps make an excellent fit with computers, and vendors have started to produce software that lets students construct maps through a flexible interface. Another exciting avenue for learning science that provides a bridge between the worlds of formal and informal learning is “citizen science.” These projects use networks to harness the power of the masses by distributing real scientific data to trained volunteers who add value to that data. As part of the Galaxy Zoo project, one hundred thousand “civilians” have classified more than forty million galaxies, with accuracy as good as the experts (Lintott et al., 2008). These projects have obvious and still-untapped applications with college students.
The first generation of digital instructional technology in the 1980s and 1990s was limited to fixed content and a linear flow of presentation and often failed to provide a rich learning experience. Electronic textbooks are a good example of such shovelware. As the technology has advanced in the past decade, it is moving toward more customizable interfaces. New teaching techniques should be able to take advantage of these changes. Some instructors have experimented with wiki-type projects, and the increasing ubiquity of Web-capable cell phones and smartphones allows instructors to push both general and customized content to students. Voice recognition and interpretation technology may soon permit students to interact with an artificial intelligence tutor and a database using text-to-speech software.
Implementing collaborative or adaptive learning environments on computers and the Internet is challenging, but the technologies exist. In a schematic view of this instructional environment (see Figure 13), the content would consist of reusable learning objects that are multimedia elements, such as hyperlinked text, interactive figures, video clips, and sound files. Their high-level organization would be shown by a concept map (Novak, 1998). Online navigation is flexible and could be directed according to a map or a tree, by keyword search, or by recommendations from other learners (examples are in the shaded box). The navigation and the interface are adaptive to the preference of the individual student user and the patterns of past users. As shown on the left of the diagram, the instructors select content and modify their interface according to learning goals, while, as shown on the right, students interact with the content either individually or collaboratively with their peers. Instructional technology has yet to incorporate these elements; at present, it is “vaporware.”However, developed with care, this framework could enhance learning and student engagement.
Figure 13: Hypothetical Learning System Utilizing Social Media and Student Feedback
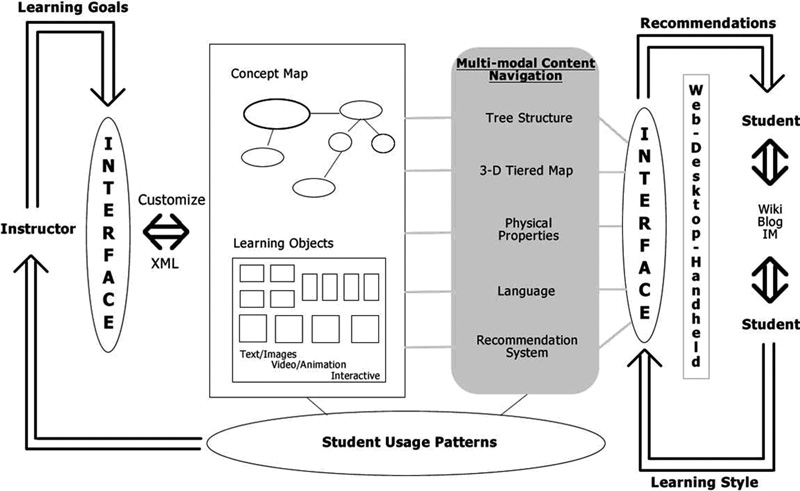
This is a schematic diagram of the components of a hypothetical adaptive learning system. The content “atoms” in such a system are reusable learning objects, linked and presented to students in a way that builds on past choices and learning preferences. To the left, the instructor provides a high-level framework for use of the content according to specified learning goals. To the right, the student user customizes his interface by learning style (text-heavy, visually rich, or audio). Some tasks are open to other learners, co-opting the architecture of social networks. Delivery would be wireless to laptops or handheld devices. This vision could be realized in the near future. Source: Figure created and provided by author.
Several transformational technologies will soon have tremendous influence on society and, inevitably, on the ways in which we teach. They are so new that as yet there is no research literature with evaluations of them in an instructional setting, and their modes of most effective use are hard to predict.
- Mobile learning (as opposed to distance learning using a desktop) will take off. In 2009, more than a billion cell phones were sold, with smartphones the fastest growing sector of that market. The early generation of PDAs and Pocket PCs has been eclipsed by highly capable small-format computers such as the netbooks, iPhones, and the very recent iPad (Schmitt, Rodriguez & Clothey, 2009). In 2009, for the first time more devices connected to the Internet wirelessly than through wired connections.
- The semantic Web will transform knowledge retrieval just as search engines transformed Web page retrieval. If a student can get a natural-language query answered in real time, most likely by intelligent agents scouring the deep Web, then retention of scientific knowledge will be superfluous for most people, just as the skill of navigation is waning with the spread of devices that take advantage of the Global Positioning System.
- In a revolution years in the making, Internet bandwidth will finally allow the network to “become” the computer and we will enter an age of ubiquitous computing. All textbooks and academic information will fit on a USB flash drive or an even smaller solid-state device within a phone. The spread of Gmail and Google Docs on campuses means that educational information is increasingly stored in the “cloud.” Soon, students will be able to do all their work anytime and anyplace. The boundary between formal and informal learning will blur even further.
- The use of social networks will increase, and their capabilities will grow. Already, most undergraduates are members of more than one social network. Educators seeking to co-opt the social graph—the map of friends of friends of a student—will be able to propagate learning tools like a virus. Facebook consumes large amounts of student time and attention for purposes that are purely social, but it is potentially a potent platform for informal and social learning. Highly interactive apps and gaming metaphors will be the most successful strategies.
- Virtual worlds like Second Life provide a rich 3-D environment for learning and constructing exhibits and models. More than 250 universities already have a presence in Second Life. For science educators, Second Life offers the capability of creating persistent models and simulations and letting students create their own projects and exhibits (Brown & Adler, 2008).
Alongside Wikipedia, the other omnipresent Internet appendage for students is Facebook. With more than four hundred million users, one hundred million of whom are in the United States, Facebook is the most popular social networking site in the world. Nearly 90 percent of all undergraduates use Facebook, and most students check the site several times a day, suggesting it has their loyalty and rapt attention. A year ago, Facebook abandoned its support of internal features that allowed students to see all the people at their university taking the same courses as them. In principle, this opened the door for a developer to create collaborative learning tools and online learning communities, though it has not happened yet. Among more than one hundred thousand Facebook applications, only a few hundred are educational, and for the most part, the educational apps do not encourage deep learning. Nonetheless, social networks are a frontier for education.
Another exciting wave of the future is the use of virtual 3-D worlds such as Second Life as social learning spaces and places where instructors and students can co-create educational experiences (Cheal, 2007; Kelton, 2007). With roughly fifteen million users, Second Life is the most popular of a set of realistic, graphically rendered virtual worlds where people move and talk and interact in the form of their electronic alter ego, or avatar. Access and avatar creation are free, but owning virtual land costs real money. On average, seventy thousand people are “in world” at any given time, or about one million over any thirty-day period. Linden Labs, the private company that operates the virtual world, oversees an economic activity with a GNP equivalent to about $1 billion, with $1.5 million in transactions every day and a convertible currency called the Linden that trades at about 260 to the dollar (Terdiman, 2008). Second Life is a technical tour de force. A server farm with three hundred terabytes of storage capacity generates a world of islands and archipelagos that extends about eight hundred (virtual) square miles. The programming is moving toward open standards, and its Havoc 4 physics engine creates realistic dynamics and visual effects.
The number of science “builds” in Second Life has steadily increased and includes virtual planetariums and science centers, as well as installations run by NASA and NOAA. For the past three years I have maintained a personal island—sixty-five thousand square meters, or sixteen acres, with a building capacity of fifteen thousand primitive geometric objects, or “prims”—for teaching and outreach purposes. With education technology specialist Adrienne Gauthier as the lead developer, and using preceptors and other paid undergraduates as content creators, this island has been successfully used in general education classes for non-science majors. Substantial support is required to familiarize students with Second Life, but the reward has been some clever and creative projects, the best of which can become permanent exhibits on the island. Conventional teaching is not well suited to a virtual world, but cooperative learning, model-building, and 3-D visualization of science concepts work well. Five years ago, nobody could have anticipated the explosive growth and varied uses of Second Life and Facebook. All that can be said for certain today is that the future of instructional technology will be exciting and difficult to predict (Alexander, 2009). Educators should fasten their seat belts for a thrilling ride.2
ENDNOTES
REFERENCES
Adams, J. P, E. E. Prather, and T. F. Slater. 2004. Lecture Tutorials for Introductory Astronomy. Upper Saddle River, N.J.: Pearson Education.
Alcock, J. 2005. Animal Behavior: An Evolutionary Approach. Sunderland, Mass.: Sinauer Associates.
Alexander, B. 2009. Apprehending the future: Emerging technologies, from science fiction to campus reality. EDUCAUSE Review 44:19–28.
American Association for the Advancement of Science (AAAS). 1990. The Liberal Art of Science: Agenda for Action. Washington, D.C.: AAAS.
American Institute of Physics (AIP). 2009. Focus on Astronomy Faculty: Results from the 2008 Survey of Physics and Astronomy Degree-Granting Departments, ed. R. Ivie, A. Ephraim, and S. White. College Park, Md.: AIP.
Anderson, J. R., and C. Lebiere. 1988. The Atomic Components of Thought. Mahwah, N.J.: Erlbaum.
———, and C. D. Schunn. 2000. Implications of the ACT-R learning theory: No magic bullets. In Advances in Instructional Psychology: Educational Design and Cognitive Science, vol. 5, ed. R. Glaser, 1–34. Mahwah, N.J.: Erlbaum.
Angelo, T. A., and K. P. Cross. 1993. Classroom Assessment Techniques: A Handbook for College Teachers. San Francisco: Jossey-Bass.
Bailey, J. M., and T. F. Slater. 2003. A review of astronomy education research. Astronomy Education Review 2:20–45.
Bain, K. 2004. What the Best College Teachers Do. Cambridge, Mass.: Harvard University Press.
Bardar, E. M., E. E. Prather, K. Brecher, and T. F. Slater. 2006. The need for a light and spectra concept inventory for assessing innovations in introductory astronomy survey courses. Astronomy Education Review 2(4):20–27.
Bergman, M. K. 2001. The deep Web: Surfacing hidden value. The Journal of Electronic Publishing 7(1):1080–1090.
Bloom, B., ed. 1956. Taxonomy of Educational Objectives. Repr., Upper Saddle River, N.J.: Pearson Education, 1987.
Boyer, E. L. 1998. Reinventing Undergraduate Education: A Blueprint for America’s Research Universities. Stony Brook: SUNY Press.
Bransford, J. D., A. L. Brown, and R. R. Cocking. 2000. How People Learn: Brain, Mind, Experience, and School. Washington, D.C.: National Academies Press.
Bridges, G. S., and S. Desmond, eds. 2000. Teaching and Learning in Large Classes. Washington, D.C.: American Sociological Association.
Brown, D. G., ed. 2000. Interactive Learning: Vignettes from America’s Most Wired Campuses. Bolton, Mass.: Anker Publishing.
———, and R. P. Adler. 2008. Minds on fire: Open education, the long tail, and learning 2.0. EDUCAUSE Review 43(1):16–32.
Bruning, D. 2007. “Survey of Introductory Astronomy Textbooks.” Astronomy Education Review 6:80–113.
Bureau of Labor Statistics. 2005. College Textbooks: Enhanced Offerings Appear to Drive Recent Price Increases. GAO-05-806. Washington, D.C.: Government Accountability Office.
Butler, D. 2009. Technology: The textbook of the future. Nature 458:568–570.
Bybee, R. W., ed. 2002. Learning Science and the Science of Learning. Arlington, Va.: NSTA Press.
Cafolla, R. 2006. Project MERLOT: Bringing peer review to Web-based educational resources. Journal of Technology and Teacher Education 14(2):313–323.
California Academy of Sciences. 2009. American adults flunk basic science. Press release. http://www.calacademy.org/newsroom/releases/2009/ scientific_literacy.php.
Cheal, C. 2007. Second Life: Hype or hyperlearning? On the Horizon 15:204– 210.
Clark, B. 2002. Growing Up Gifted: Developing the Potential of Children at School and at Home. Upper Saddle River, N.J.: Merrill Prentice Hall.
Collins, H., and R. Evans. 2007. Rethinking Expertise. Chicago: University of Chicago Press.
Comins, N. F. 2001. Heavenly Errors: Misconceptions about the Real Nature of the Universe. New York: Columbia University Press.
Committee on Undergraduate Science Education. 1997. Science Teaching Reconsidered: A Handbook. Washington, D.C.: National Academies Press.
Corder, G. 2005. Interactive learning with Java applets: Using interactive, Web-based Java applets to present science in a concrete, meaningful manner. Science Teacher 72(8):44–50.
Crouch, C. H., and E. Mazur. 2001. Peer instruction: Ten years of experience and results. American Journal of Physics 69:970–977.
Dancy, M. H., and R. J. Beichner. 2002. But are they learning? Getting started in classroom evaluation. Cell Biology Education 1:87–94.
Danielson, C., and L. Abrutyn. 1997. An Introduction to Using Portfolios in the Classroom. Alexandria, Va.: Association for Supervision and Curriculum Development.
Davis, B. G. 1993. Tools for Teaching. San Francisco: Jossey-Bass.
Dickens, C. 1859. A Tale of Two Cities. Repr., New York: Signet Classics, 1997.
Donovan, M. S., and J. D. Bransford, eds. 2005. How Students Learn: Science in the Classroom. Washington, D.C.: National Academies Press.
———, J. D. Bransford, and J. W. Pellegrino, eds. 1999. How People Learn: Bridging Research and Practice. Washington, D.C.: National Academies Press.
Duncan, D., and E. Mazur. 2005. Clickers in the Classroom: How to Enhance Science Teaching Using Classroom Response Systems. Upper Saddle River, N.J.: Pearson Education.
Duschl, R. 2008. Science education in three-part harmony: Balancing conceptual, epistemic, and social learning goals. Review of Research in Education 32(1):268–291.
Emery, C. R., T. R. Kramer, and R. G. Tian. 2003. Return to academic standards: A critique of student evaluations of teaching effectiveness. Quality Assurance in Education 11(1):37–46.
Fairweather, J. S. 1993. Faculty reward structures: Toward institutional and professional homogenization. Research in Higher Education 34(5):603–623.
Fraknoi, A. 2001. Enrollments in Astronomy 101 courses. Astronomy Education Review 1:121–123.
———. 2004. Insights from a survey of astronomy instructors in community and other teaching-oriented colleges in the United States. Astronomy Education Review 3:7–16.
Gabel, D. L., ed. 1994. Handbook of Research on Science Teaching and Learning. New York: Macmillan.
Gantz, J. F., D. Reinsel, C. Chute, W. Schlichting, J. McArthur, S. Minton, I. Xheneti, A. Toncheva, and A. Manfrediz. 2007. The Expanding Digital Universe: A Forecast of Worldwide Information Growth through 2010. Framingham, Mass.: IDC. http://www.emc.com/collateral/analyst-reports/expanding-digital-idc-white-paper.pdf.
Garrison, D. R., and T. Anderson. 2003. E-learning in the 21st Century: A Framework for Research and Practice. New York: Routledge.
Giles, J. 2005. Internet encyclopedias go head to head. Nature 438:900–901.
Green, P. J. 2003. Peer Instruction in Astronomy. Upper Saddle River, N.J.: Pearson Education.
Hake, R. R. 1998. Interactive engagement versus traditional methods: A six-thousand-student survey of mechanics test data for introductory physics courses. American Journal of Physics 66:64–78.
Hazen, R. M., and J. Trefil. 1991. Science Matters: Achieving Science Literacy. New York: Doubleday.
Horrigan, J. B. 2006. The Internet as a Resource for News and Information about Science. Washington, D.C.: Pew Internet and American Life Project. http://www.pewinternet.org/Reports/2006/The-Internet-as-a-Resource -for-News-and-Information-about-Science.aspx.
Hudgins, D. W., E. E. Prather, D. J. Grayson, and D. P. Smits. 2006. Effectiveness of collaborative ranking tasks on student understanding of key astronomy concepts. Astronomy Education Review 5(1):1–22.
Hufnagel, B. 2002. Development of the astronomy diagnostic test. Astronomy Education Review 1:47–51.
Impey, C. D., S. Buxner, J. Antonellis, E. Johnson, and C. King. 2010. A twenty year survey of science literacy among college undergraduates. Journal of College Science Teaching.
Johnson, A. H., and F. Percival. 1976. Attention breaks in lectures. Education in Chemistry 13:49–50.
Johnson, L., A. Levine, R. Smith, and S. Stone. 2010. The 2010 Horizon Report. Austin, Tex.: The New Media Consortium.
Kelton, A. J. 2007. Second Life: Reaching into the virtual world for real-world learning. EDUCAUSE Center for Applied Research Bulletin 17 (August 14). http://www.educause.edu/ECAR/SecondLifeReachingintotheVirtu/161863.
Kitao, T. K. 1999. The usefulness of uselessness. Keynote address at the Institute for the Academic Advancement of Youth’s Odyssey, Swarthmore College.
Lazarowitz, R., R. Hertz-Lazarowitz, and J. H. Baird. 2006. Learning science in a cooperative setting: Academic achievement and affective outcomes. Journal of Research in Science Teaching 31(10):1121–1131.
Lintott, C. J., K. Schawinski, A. Slosar, K. Land, S. Bamford, D. Thomas, and M. J. Raddick. 2008. Galaxy Zoo: Morphologies derived from visual inspection of galaxies from the Sloan Digital Sky Survey. Monthly Notices of the Royal Astronomical Society 389:1179–1189.
Lyman, F. 1987. Think-pair-share: An expanding teaching technique. MAACIE Cooperative Views 1:1–2.
Mayer, R. E. 2004. Should there be a three-strikes rule against pure discovery learning? American Psychologist 59:11–14.
Mazur, E. 1996. Peer Instruction: A User’s Manual. New York: Pearson.
Miller, J. D. 2004. Public attitudes toward, and understanding of, scientific research: What we know and what we need to know. Public Understanding of Science 13(3):273–294.
Millis, B. J., and P. G. Cottell. 1998. Cooperative Learning for Higher Education Faculty. American Council on Education Series on Higher Education. Phoenix: Oryx Press.
Mintzes, J. J., and W. H. Leonard. 2006. Handbook of College Science Teaching. Arlington, Va.: NSTA Press.
National Research Council. 1999. Transforming Undergraduate Education in Science, Mathematics, Engineering, and Technology. Washington, D.C.: National Academies Press.
National Science Board. 2008. Science and Engineering Indicators. Arlington, Va.: National Science Foundation.
———. 2010. Science and Engineering Indicators. Arlington, Va.: National Science Foundation.
National Science Teachers Association (NSTA). 2002. Innovative Techniques for Large-Group Instruction. Arlington, Va.: NSTA Press.
Northrup, P. 2007. Learning Objects for Instruction: Design and Evaluation. Hershey, Pa.: Information Science Publishing.
Novak, J. D. 1998. Learning, Creating and Using Knowledge: Concept Maps as Facilitative Tools in Schools and Corporations. Philadelphia: Lawrence Erlbaum Associates.
———. 2002. Meaningful learning: The essential factor for conceptual change in limited or inappropriate propositional hierarchies leading to empowerment of learners. Science Education 86:548–571.
———, and A. S. Cañas. 2008. The Theory Underlying Concept Maps and How to Construct and Use Them. Technical Report IHMC CmapTools 2006-01. Pensacola: Florida Institute for Human and Machine Cognition. http://cmap.ihmc.us/Publications/ResearchPapers/TheoryCmaps/TheoryUnderlyingConceptMaps.htm.
Oblinger, D. G., and J. L. Oblinger, eds. 2005. Educating the Net Generation. Washington, D.C.: EDUCAUSE. http://www.educause.edu/educatingthenetgen.
O’Neil, D. K., and J. L. Polman. 2004. Why educate “little scientists”? Examining the potential of practice-based scientific literacy. Journal of Research in Science Teaching 41:234–266.
Palloff, R. M., and K. Pratt. 2001. Lessons from the Cyberspace Classroom. San Francisco: Jossey-Bass.
Partridge, B., and G. Greenstein. 2004. “Goals for Astro 101: Report on Workshops for Department Leaders.” Astronomy Education Review 2(2):46–89.
Pompea, S. M. 2000. Great Ideas for Teaching Astronomy. 3rd ed. Florence, Ky.: Thomson Learning.
Prather, E. E., A. L. Rudolph, G. Brissenden, and W. M. Schlingman. 2008. A national study assessing the teaching and learning of introductory astronomy, Part I: The effect of interactive instruction. American Journal of Physics 77:320–330.
———, T. F. Slater, J. P. Adams, J. M. Bailey, L. V. Jones, and J. A. Dostal. 2005. Research on a lecture-tutorial approach for teaching astronomy for non-science majors. Astronomy Education Review 3(2):122–136.
———, T. F. Slater, J. P. Adams, and J. M. Bailey. 2004. Research on a lecture-tutorial approach to teaching introductory astronomy for non-science majors. Astronomy Education Review 3(2):122–137.
Rainie, L., and B. Tancer. 2007. Data memo. Washington, D.C.: Pew Internet and American Life Project. http://www.pewinternet.org/~/media/Files/ Reports/2007/PIP_Wikipedia07.pdf.pdf.
Ripoff 101. 2005. How the Publishing Industry’s Practices Needlessly Drive Up Textbook Costs. 2nd ed. Washington, D.C.: State Public Interest Research Groups.
Schmitt, C., J. Rodriguez, and R. Clothey. 2009. Education in Motion: From iPod to iPhone. Proceedings of World Conference on Educational Multimedia, Hypermedia, and Telecommunications. Chesapeake, Va.: AACE, 2308–2313.
Schwartz, D. L., and J. D. Bransford. 1998. A time for telling. Cognition and Instruction 16:475–522.
Shamos, M. H. 1995. The Myth of Scientific Literacy. Piscataway, N.J.: Rutgers University Press.
Slater, T. F., and J. P. Adams. 2003. Learner-Centered Astronomy Teaching: Strategies for Astro 101. Upper Saddle River, N.J.: Pearson Education.
Sweller, J. 1994. Cognitive load theory, learning difficulty, and instructional design. Learning and Instruction 4:295–312.
Terdiman, D. 2008. The Entrepreneur’s Guide to Second Life: Making Money in the Metaverse. Indianapolis: Wiley.
Thagard, P. 2005. Mind: Introduction to Cognitive Science. Cambridge, Mass.: MIT Press.
Tobias, S. 1991. They’re not dumb, they’re different: Stalking the second tier. American Journal of Physics 59:1155–1157.
Tullis, T. 2008. Results of online usability study of Apollo program websites. Measuring User Experience. http://www.measuringuserexperience.com/Apollo/.
Weiman, C., and K. Perkins. 2005. Transforming physics education. Physics Today 58:36–41.