Regional & Institutional Differences in Humanities Education at Community Colleges
Findings and Trends
- Institutions in the south were less likely to offer LOTE courses (Figure 8).
- As mentioned above, when comparing groups of institutions in terms of their share of national enrollment in humanities courses, the point of reference should be their share of total enrollment. Community colleges in the south accounted for the largest share of the students taking humanities courses nationally, approximately 38% (over one million in enrollment across all humanities disciplines; Figure 9). This share was proportionate to the region’s share of community college enrollment (35%; represented on the graph as a dashed orange line).
- Students at western institutions were less likely to be humanities coursetakers than one would expect, based on the share of total enrollment they represented. While western institutions enrolled 33% of the nation’s community college students, they were home to only approximately 26% of humanities coursetakers.
- The southern region is notable in that while it represented 35% of community college enrollment, it was home to only 24% (approximately) of the nation’s LOTE coursetakers. In contrast, students in the west were more likely to take LOTE classes than one would expect, based on the share of total enrollment they represented.
- History coursetakers were overrepresented at southern institutions, constituting approximately 45% of the national total (as compared to 35% of total enrollment). Students at midwestern institutions were particularly likely to take philosophy courses, with approximately 28% having done so, although midwestern students were only 20% of the national community college population.
- When different types of institutions are compared, the data suggest that while English courses were very likely to be offered at every type of institution, colleges with a focus on career and technical education (CTE) were less likely to offer a course in LOTE than other types of institution (Figure 10).
- Transfer institutions accounted for the largest number of students enrolled at community colleges, with students who attended such institutions representing almost half of the total student population in the fall term of 2015 (not pictured; see table 5 in the Appendix to the full report). Transfer institutions’ share of the humanities coursetaker population was proportionate to this (Figure 11). With approximately 1.3 million students taking at least one humanities course at a transfer institution, this type of institution provided humanities education to a far larger number of students than any other.
- Transfer colleges accounted for a disproportionately large share of community college students taking courses in LOTE and history (approximately 56% and 53%, respectively, of the students taking such courses). As one might expect in view of the finding that CTE institutions were less likely than other types of schools to offer LOTE courses, students at these institutions were underrepresented among the LOTE coursetaking population.
Share of Community Colleges Offering at Least One Course in the Humanities, by Discipline and Region, Fall 2015
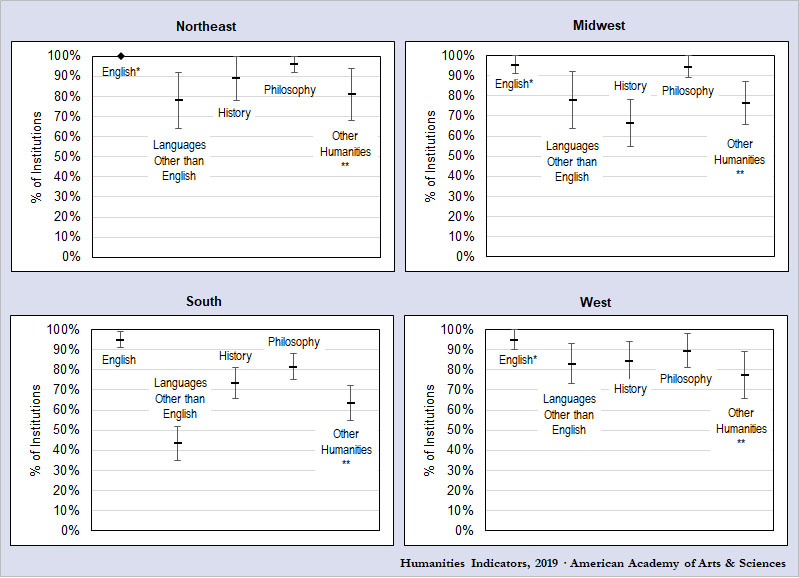
The middle bar depicts the estimated proportion, and the upper and lower bars depict the range of uncertainty.
t All the responding institutions in the northeast offer English; it is possible that some of the non-responding institutions in this region do not offer English.
* Even though an interval extends to 100%, we know that not all institutions in the region offer a course in the discipline.
** Includes: 1) survey courses entitled “Humanities”; and 2) courses coded in colleges’ information systems as humanities but not counted in the other disciplinary categories.
Nine institutions included in the study are located in US territories; their data are not included in this table. For the values underlying this figure, see American Academy of Arts Sciences, Humanities Indicators, “Humanities Education in Community Colleges: A Pilot Study,” https://humanitiesindicators.org/binaries/pdf/HI_Humanities_Education_in_Community_Colleges.pdf (March 2019), appendix, tables E3, FL3, H3, P3, and OH3.
Regional Distribution of Humanities Coursetakers at Community Colleges, by Discipline, Fall 2015
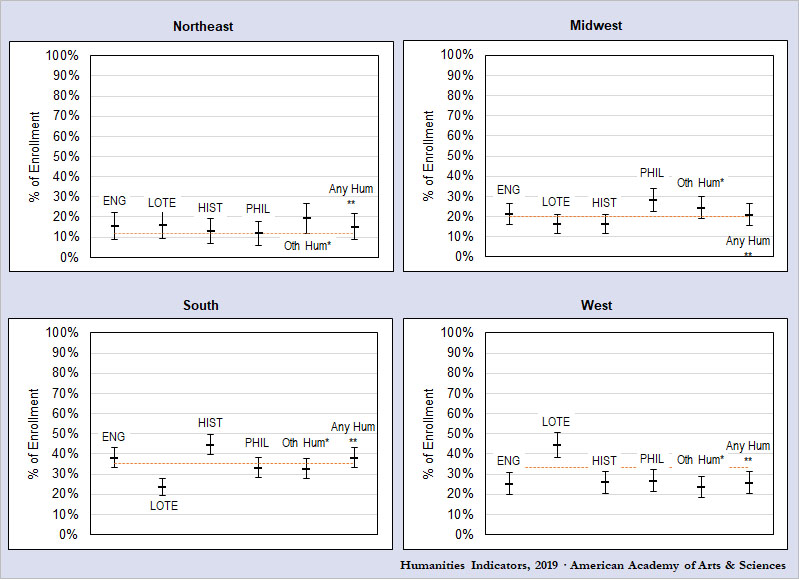
ENG: English • LOTE: Languages Other than English • HIST: History • PHIL: Philosophy
The middle bar depicts the estimated proportion, and the upper and lower bars depict the range of uncertainty. The orange dashed line indicates the proportion of total community college enrollment in each region.
* Oth Hum: Other humanities, includes: 1) survey courses entitled “Humanities”; and 2) courses coded in colleges’ information systems as humanities that were not counted in the other disciplinary categories.
** Any Hum: Any humanities course.
Nine institutions included in the study are located in US territories; their data were excluded from this analysis. These data were calculated by SRC staff for the Humanities Indicators.
Share of Community Colleges Offering at Least One Humanities Course, by Discipline and Institution Type, Fall 2015
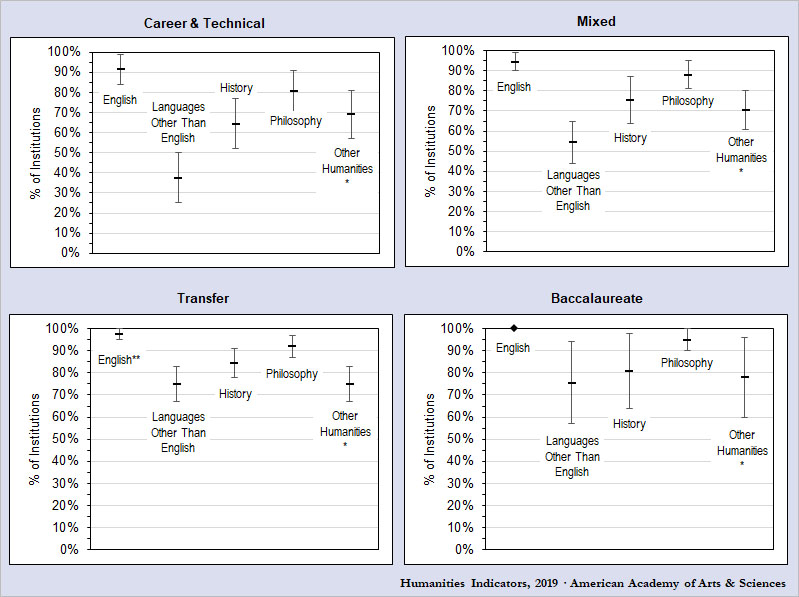
The middle bar depicts the estimated proportion, and the upper and lower bars depict the range of uncertainty.
t All the responding baccalaureate institutions in this group offer English; it is possible that some of the non-responding institutions of this type do not offer English.
* Includes: 1) survey courses entitled “Humanities”; and 2) courses coded in colleges’ information systems as humanities that were not counted in the other disciplinary categories.
** Even though the bounds for the proportion of schools offering English among transfer institutions extends to 100%, we know that there are transfer institutions that do not offer English.
Three institutions included in the study were not part of the 2015 Carnegie universe; their data have been excluded from this analysis. For the values underlying this figure, see American Academy of Arts Sciences, Humanities Indicators, “Humanities Education in Community Colleges: A Pilot Study,” https://humanitiesindicators.org/binaries/pdf/HI_Humanities_Education_in_Community_Colleges.pdf (March 2019), appendix, tables E4, FL4, H4, P4, and OH4.
Distribution of Humanities Coursetakers at Community Colleges Across Institution Types, by Discipline, Fall 2015
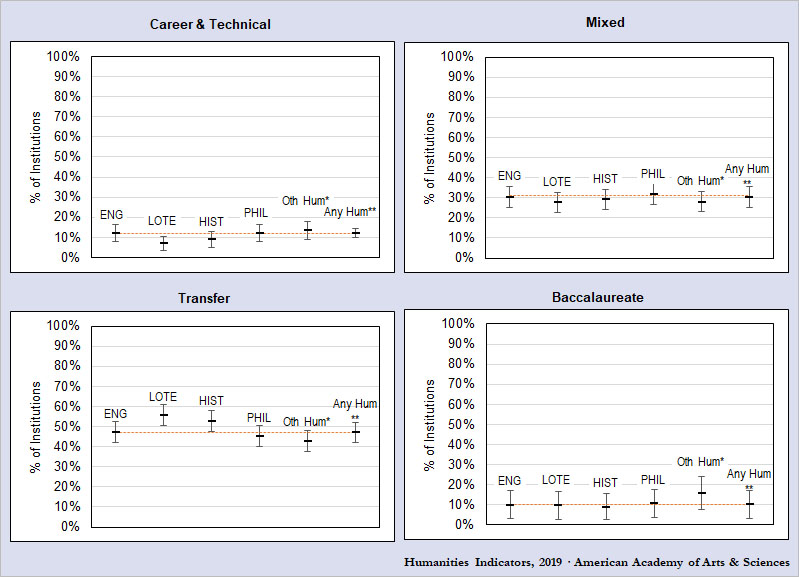
ENG: English • LOTE: Languages Other than English • HIST: History • PHIL: Philosophy
The middle bar depicts the estimated proportion, and the upper and lower bars depict the range of uncertainty. The orange dashed line indicates the proportion of total community college enrollment in each institution type.
* Oth Hum: Other humanities, includes: 1) survey courses entitled “Humanities”; and 2) courses coded in colleges’ information systems as humanities that were not counted in the other disciplinary categories.
** Any Hum: Any humanities course
Three institutions included in the study were not part of the 2015 Carnegie universe; their data have been excluded from this analysis. These data were calculated by SRC staff for the Humanities Indicators.
Information on this site is meant to be used and shared. Feel free to copy, distribute, and transmit text and images from the Humanities Indicators, with attribution.
