Occupationally Oriented Activities for Doctoral Students, 2011–12 Academic Year (Nonacademic Employment Only)
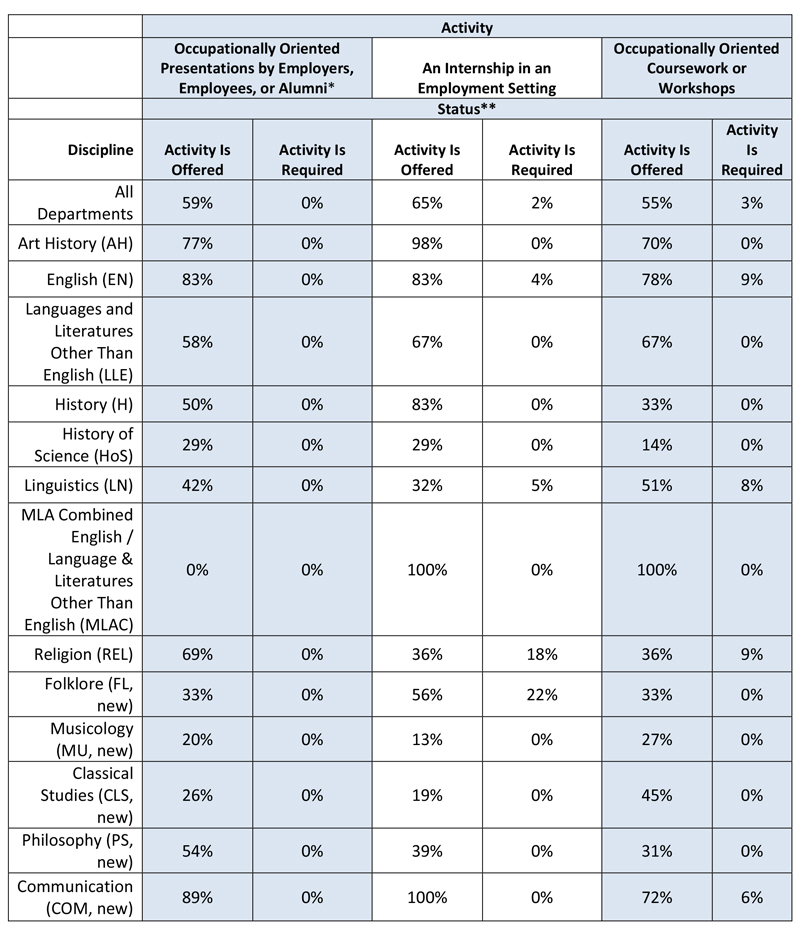
* Includes job fairs geared to the interests of the department’s majors.
** The survey offered three choices (“Activity is not offered,” “Activity is offered,” “Activity is required”); respondents could choose only one. Thus, the total proportion of departments that participate in the activity is the sum of the two columns; the difference between this sum and 100% is the proportion of departments that do not offer the activity.
Source: Susan White, Raymond Chu, and Roman Czujko, The 2012–13 Survey of Humanities Departments at Four-Year Institutions (College Park, MD: Statistical Research Center, American Institute of Physics, 2014). Study conducted for the American Academy of Arts Sciences’ Humanities Indicators Project.
Information on this site is meant to be used and shared. Feel free to copy, distribute, and transmit text and images from the Humanities Indicators, with attribution.
