English Language and Literatures
HDS-1 Departments and Faculty Members in English Language and Literatures, by Carnegie Classification and Highest Degree Offered, Fall 2012
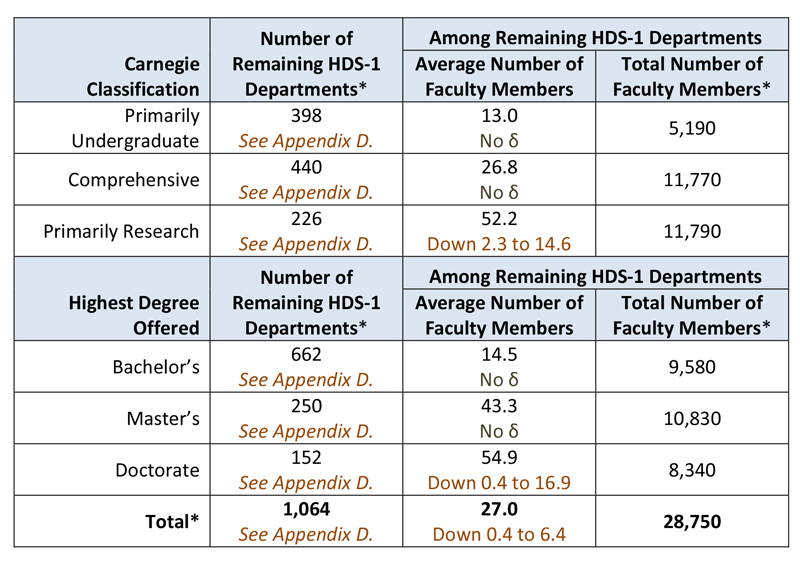
* These values should not be compared directly with 2007 data since these data do not include any departments that have been created in the interim. These data can be interpreted as estimates of minima for all 2012–13 departments combined.
Source: Susan White, Raymond Chu, and Roman Czujko, The 2012–13 Survey of Humanities Departments at Four-Year Institutions (College Park, MD: Statistical Research Center, American Institute of Physics, 2014). Study conducted for the American Academy of Arts Sciences’ Humanities Indicators Project.
Source: Susan White, Raymond Chu, and Roman Czujko, The 2012–13 Survey of Humanities Departments at Four-Year Institutions (College Park, MD: Statistical Research Center, American Institute of Physics, 2014). Study conducted for the American Academy of Arts Sciences’ Humanities Indicators Project.
The 95% confidence interval for the change in average per department from 2007 data is provided in italics; the width of the interval indicates the uncertainty in the estimate. “No δ” indicates any change exhibited is not statistically significant.
Faculty Members at HDS-1 Departments* by Employment Status and Gender, Fall 2012
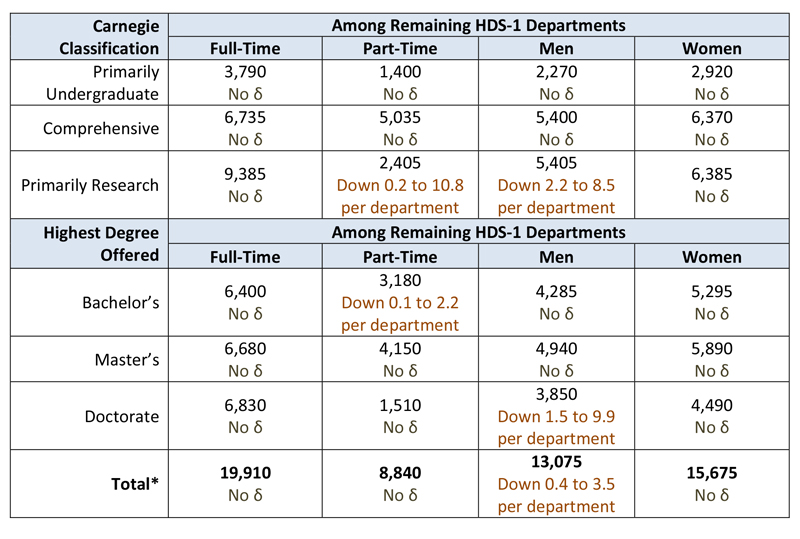
* These values should not be compared directly with 2007 data since these data do not include any departments that have been created in the interim. These data can be interpreted as estimates of minima for all 2012–13 departments combined.
Source: Susan White, Raymond Chu, and Roman Czujko, The 2012–13 Survey of Humanities Departments at Four-Year Institutions (College Park, MD: Statistical Research Center, American Institute of Physics, 2014). Study conducted for the American Academy of Arts Sciences’ Humanities Indicators Project.
Source: Susan White, Raymond Chu, and Roman Czujko, The 2012–13 Survey of Humanities Departments at Four-Year Institutions (College Park, MD: Statistical Research Center, American Institute of Physics, 2014). Study conducted for the American Academy of Arts Sciences’ Humanities Indicators Project.
The 95% confidence interval for the change in average per department from 2007 data is provided in italics; the width of the interval indicates the uncertainty in the estimate. “No δ” indicates any change exhibited is not statistically significant.
Number of Remaining HDS-1 Departments* by Carnegie Classification and Highest Degree Offered, Fall 2012
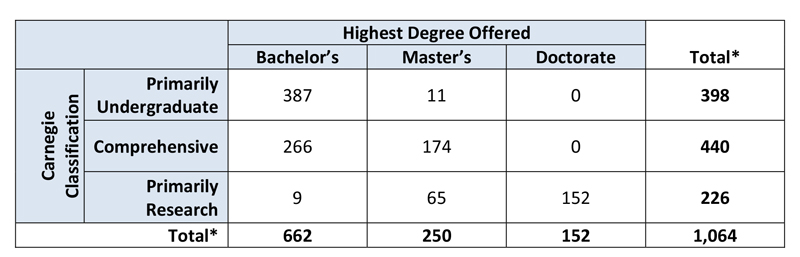
*These values should not be compared directly with 2007 data since these data do not include any departments that have been created in the interim. These data can be interpreted as estimates of minima for all 2012–13 departments combined.
Source: Susan White, Raymond Chu, and Roman Czujko, The 2012–13 Survey of Humanities Departments at Four-Year Institutions (College Park, MD: Statistical Research Center, American Institute of Physics, 2014). Study conducted for the American Academy of Arts Sciences’ Humanities Indicators Project.
Source: Susan White, Raymond Chu, and Roman Czujko, The 2012–13 Survey of Humanities Departments at Four-Year Institutions (College Park, MD: Statistical Research Center, American Institute of Physics, 2014). Study conducted for the American Academy of Arts Sciences’ Humanities Indicators Project.
The 95% confidence interval for the change from 2007 data is shown; the width of the interval indicates the uncertainty in the estimate. “No δ” indicates any change exhibited is not statistically significant.
Bachelor’s Degrees Completed in English in HDS-1 Departments in the 2011–12 Academic Year
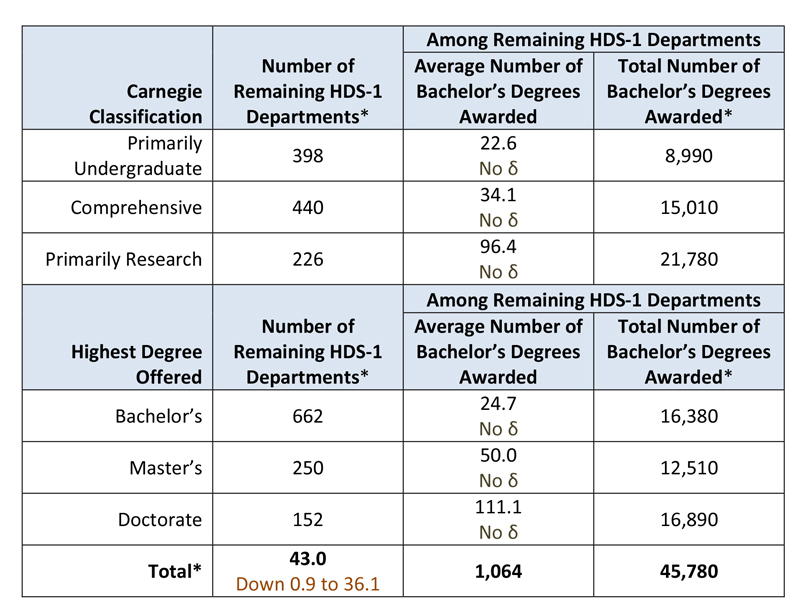
* These values should not be compared directly with 2007 data since these data do not include any departments that have been created in the interim. These data can be interpreted as estimates of minima for all 2012–13 departments combined.
Source: Susan White, Raymond Chu, and Roman Czujko, The 2012–13 Survey of Humanities Departments at Four-Year Institutions (College Park, MD: Statistical Research Center, American Institute of Physics, 2014). Study conducted for the American Academy of Arts Sciences’ Humanities Indicators Project.
Source: Susan White, Raymond Chu, and Roman Czujko, The 2012–13 Survey of Humanities Departments at Four-Year Institutions (College Park, MD: Statistical Research Center, American Institute of Physics, 2014). Study conducted for the American Academy of Arts Sciences’ Humanities Indicators Project.
The 95% confidence interval for the change in average per department from 2007 data is provided in italics; the width of the interval indicates the uncertainty in the estimate. “No δ” indicates any change exhibited is not statistically significant.
Number of Juniors and Seniors with Declared Major in English in HDS-1 Departments as of the Beginning of the Fall 2012 Term
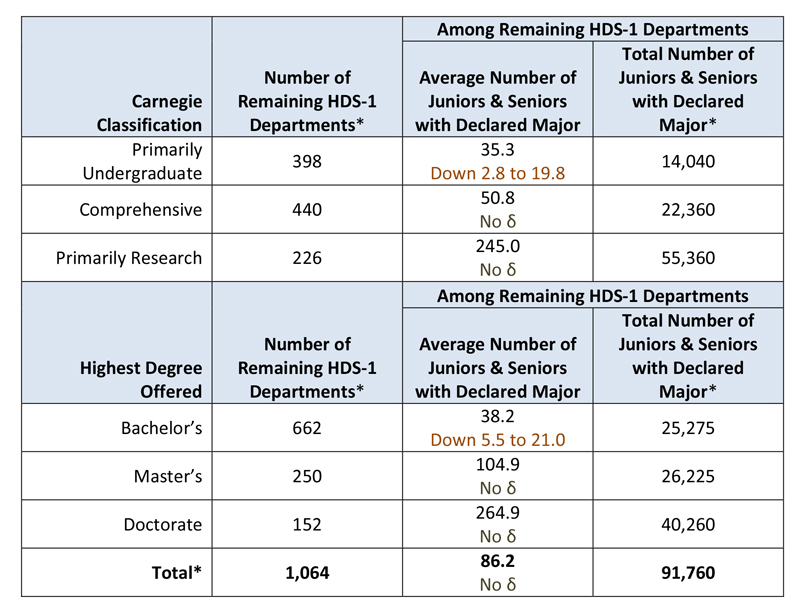
* These values should not be compared directly with 2007 data since these data do not include any departments that have been created in the interim. These data can be interpreted as estimates of minima for all 2012–13 departments combined.
Source: Susan White, Raymond Chu, and Roman Czujko, The 2012–13 Survey of Humanities Departments at Four-Year Institutions (College Park, MD: Statistical Research Center, American Institute of Physics, 2014). Study conducted for the American Academy of Arts Sciences’ Humanities Indicators Project.
Source: Susan White, Raymond Chu, and Roman Czujko, The 2012–13 Survey of Humanities Departments at Four-Year Institutions (College Park, MD: Statistical Research Center, American Institute of Physics, 2014). Study conducted for the American Academy of Arts Sciences’ Humanities Indicators Project.
The 95% confidence interval for the change in average per department from 2007 data is provided in italics; the width of the interval indicates the uncertainty in the estimate. “No δ” indicates any change exhibited is not statistically significant.
Number of Students Completing a Minor in English during the 2011–12 Academic Year
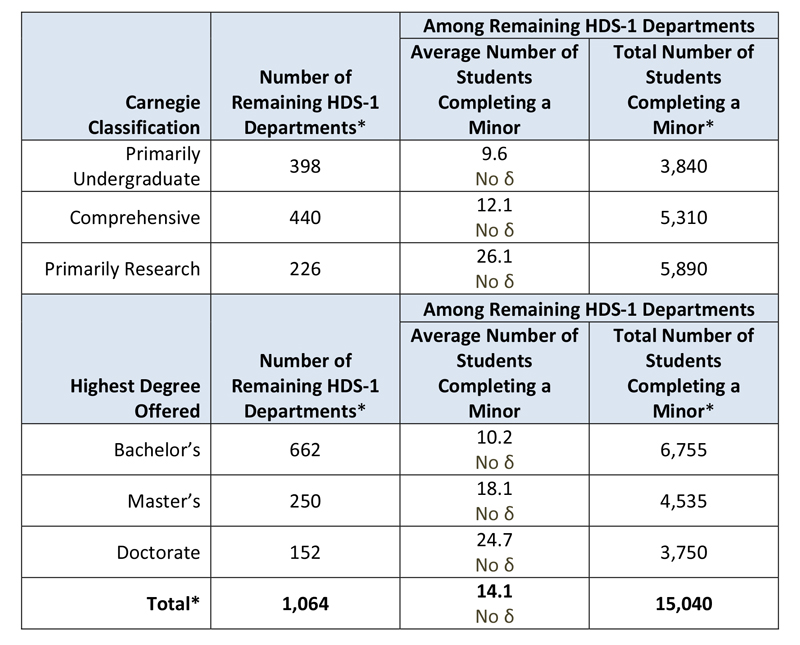
* These values should not be compared directly with 2007 data since these data do not include any departments that have been created in the interim. These data can be interpreted as estimates of minima for all 2012–13 departments combined.
Source: Susan White, Raymond Chu, and Roman Czujko, The 2012–13 Survey of Humanities Departments at Four-Year Institutions (College Park, MD: Statistical Research Center, American Institute of Physics, 2014). Study conducted for the American Academy of Arts Sciences’ Humanities Indicators Project.
Source: Susan White, Raymond Chu, and Roman Czujko, The 2012–13 Survey of Humanities Departments at Four-Year Institutions (College Park, MD: Statistical Research Center, American Institute of Physics, 2014). Study conducted for the American Academy of Arts Sciences’ Humanities Indicators Project.
The 95% confidence interval for the change in average per department from 2007 data is provided in italics; the width of the interval indicates the uncertainty in the estimate. “No δ” indicates any change exhibited is not statistically significant.
Number of Graduate Students in English during Fall 2012 Term
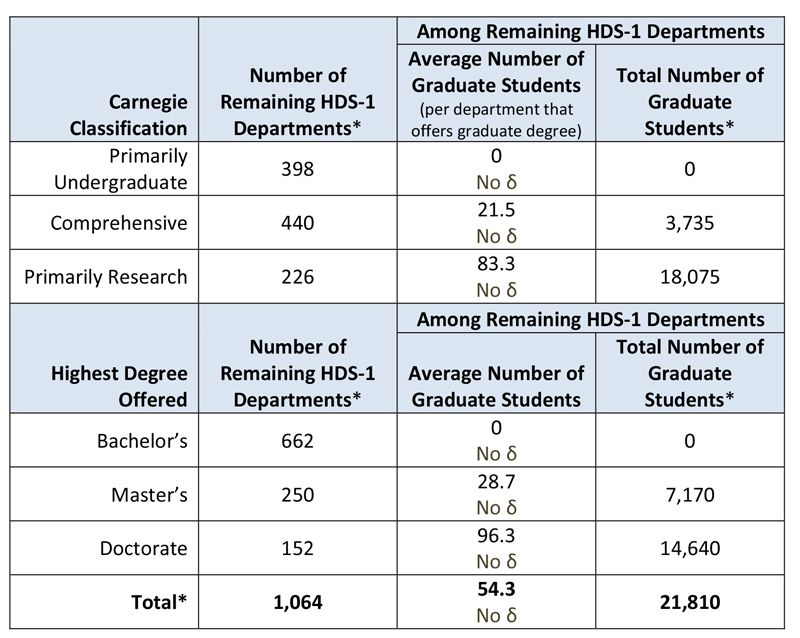
* These values should not be compared directly with 2007 data since these data do not include any departments that have been created in the interim. These data can be interpreted as estimates of minima for all 2012–13 departments combined.
Source: Susan White, Raymond Chu, and Roman Czujko, The 2012–13 Survey of Humanities Departments at Four-Year Institutions (College Park, MD: Statistical Research Center, American Institute of Physics, 2014). Study conducted for the American Academy of Arts Sciences’ Humanities Indicators Project.
Source: Susan White, Raymond Chu, and Roman Czujko, The 2012–13 Survey of Humanities Departments at Four-Year Institutions (College Park, MD: Statistical Research Center, American Institute of Physics, 2014). Study conducted for the American Academy of Arts Sciences’ Humanities Indicators Project.
The 95% confidence interval for the change in average per department from 2007 data is provided in italics; the width of the interval indicates the uncertainty in the estimate. “No δ” indicates any change exhibited is not statistically significant.
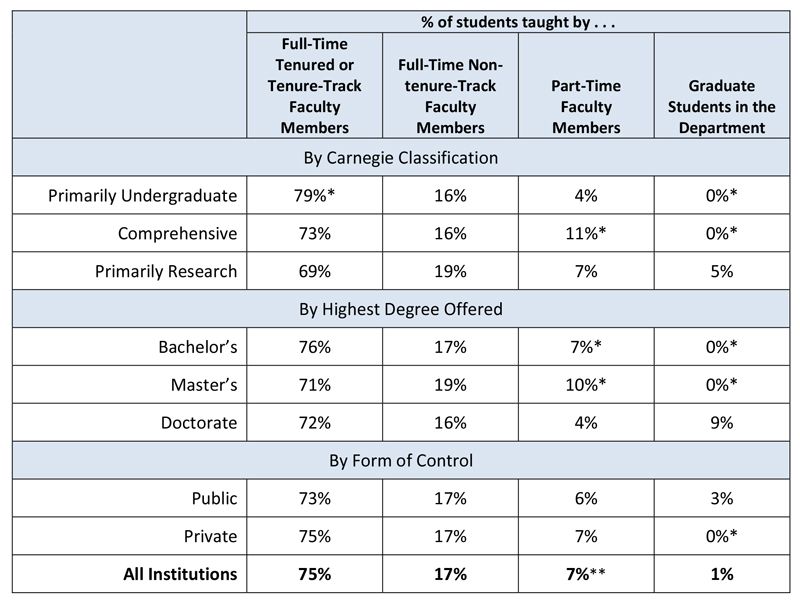
Instructor of Record for Introductory Undergraduate Courses in English in HDS-1 Departments, Fall 2012 Term
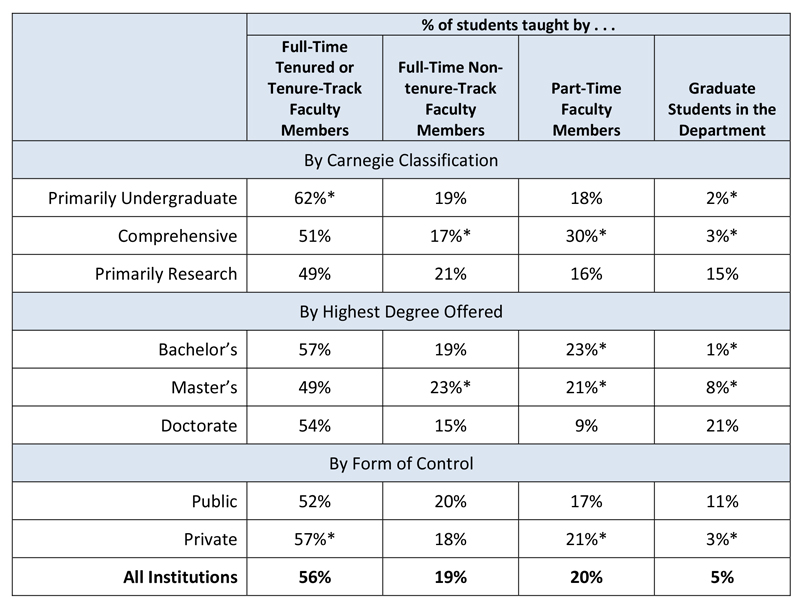
* Proportion is significantly different from Primarily Research (for Carnegie Classification) or from Doctorate (for Highest Degree Offered) or from Public (for Form of Control) at the 5% level.
We used regression analysis for these tests with a binary (0-1) variable for the level of interest. If the coefficient for the binary variable differed significantly from 0, then the interpretation from regression is that the discipline differs from all other levels combined.
Statistical significance depends on a number of factors, not solely the absolute difference between two values. While differences that are not marked as significant may seem to be the same size as, or even larger than, those marked as significant, they are not statistically significant. The most likely factors contributing to the lack of significance when the absolute difference seems “large enough” are a smaller sample size or a larger variation within that discipline.
Source: Susan White, Raymond Chu, and Roman Czujko, The 2012–13 Survey of Humanities Departments at Four-Year Institutions (College Park, MD: Statistical Research Center, American Institute of Physics, 2014). Study conducted for the American Academy of Arts Sciences’ Humanities Indicators Project.
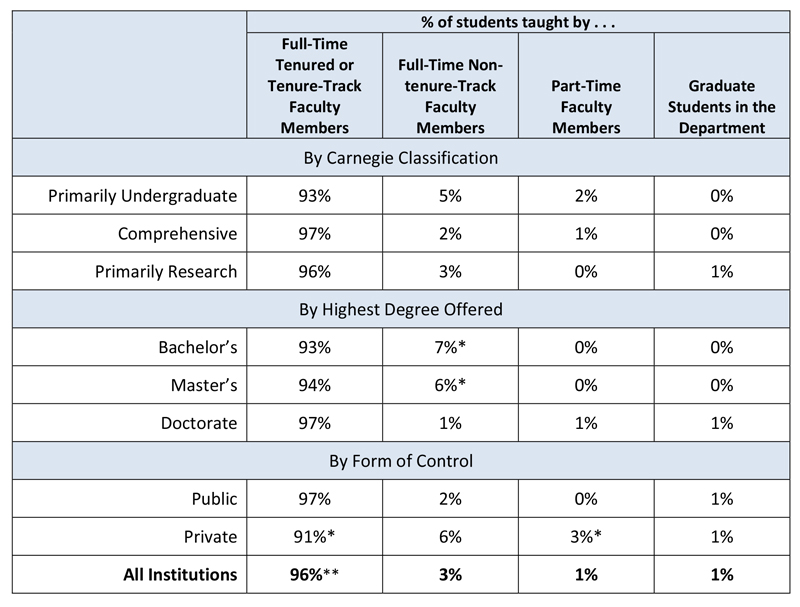
Instructor of Record for All Other (Non-Introductory) Undergraduate Courses in English in HDS-1 Departments, Fall 2012 Term
* Proportion is significantly different from Primarily Research (for Carnegie Classification) or from Doctorate (for Highest Degree Offered) or from Public (for Form of Control) at the 5% level.
** Proportion is significantly different from all other disciplines combined at the 5% level. We used regression analysis for these tests with a binary (0-1) variable for the level of interest. If the coefficient for the binary variable differed significantly from 0, then the interpretation from regression is that the discipline differs from all other levels combined.
Statistical significance depends on a number of factors, not solely the absolute difference between two values. While differences that are not marked as significant may seem to be the same size as, or even larger than, those marked as significant, they are not statistically significant. The most likely factors contributing to the lack of significance when the absolute difference seems “large enough” are a smaller sample size or a larger variation within that discipline.
Source: Susan White, Raymond Chu, and Roman Czujko, The 2012–13 Survey of Humanities Departments at Four-Year Institutions (College Park, MD: Statistical Research Center, American Institute of Physics, 2014). Study conducted for the American Academy of Arts Sciences’ Humanities Indicators Project.
Instructor of Record for All Graduate Courses in English in HDS-1 Departments, Fall 2012 Term
* Proportion is significantly different from Primarily Research (for Carnegie Classification) or from Doctorate (for Highest Degree Offered) or from Public (for Form of Control) at the 5% level.
** Proportion is significantly different from all other disciplines combined at the 5% level.
We used regression analysis for these tests with a binary (0-1) variable for the level of interest. If the coefficient for the binary variable differed significantly from 0, then the interpretation from regression is that the discipline differs from all other levels combined.
Statistical significance depends on a number of factors, not solely the absolute difference between two values. While differences that are not marked as significant may seem to be the same size as, or even larger than, those marked as significant, they are not statistically significant. The most likely factors contributing to the lack of significance when the absolute difference seems “large enough” are a smaller sample size or a larger variation within that discipline.
Source: Susan White, Raymond Chu, and Roman Czujko, The 2012–13 Survey of Humanities Departments at Four-Year Institutions (College Park, MD: Statistical Research Center, American Institute of Physics, 2014). Study conducted for the American Academy of Arts Sciences’ Humanities Indicators Project.
Assessment* of Overall Undergraduate Student Learning in English in HDS-1 Departments as of the Fall 2012 Term
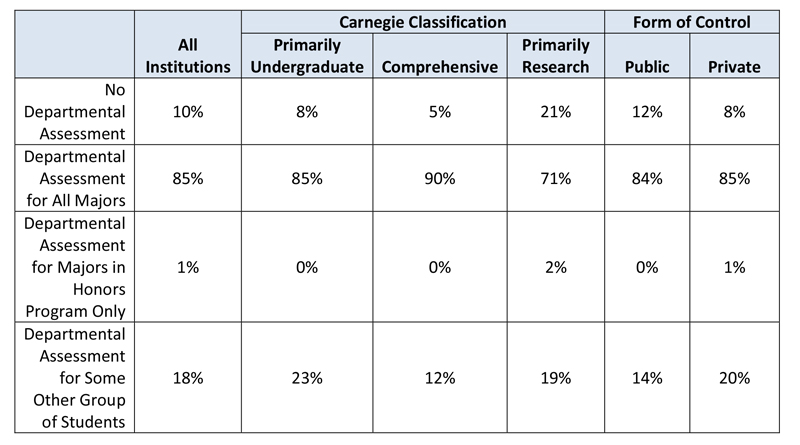
Note: The sum of the four rows in any column may exceed 100% because respondents could select multiple choices.
* The “assessment” is an aggregate assessment based on examining the results from a given cohort of students in an attempt to examine the effectiveness of a program.
Source: Susan White, Raymond Chu, and Roman Czujko, The 2012–13 Survey of Humanities Departments at Four-Year Institutions (College Park, MD: Statistical Research Center, American Institute of Physics, 2014). Study conducted for the American Academy of Arts Sciences’ Humanities Indicators Project.
Considerations in Tenure Decisions in English in HDS-1 Departments, Fall 2012
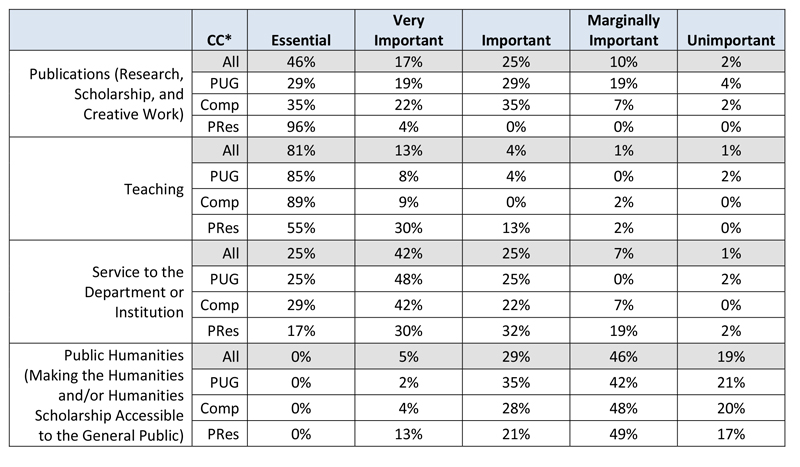
* CC—Carnegie Classification: PUG—Primarily Undergraduate, Comp—Comprehensive, PRes—Primarily Research
Source: Susan White, Raymond Chu, and Roman Czujko, The 2012–13 Survey of Humanities Departments at Four-Year Institutions (College Park, MD: Statistical Research Center, American Institute of Physics, 2014). Study conducted for the American Academy of Arts Sciences’ Humanities Indicators Project.
Source: Susan White, Raymond Chu, and Roman Czujko, The 2012–13 Survey of Humanities Departments at Four-Year Institutions (College Park, MD: Statistical Research Center, American Institute of Physics, 2014). Study conducted for the American Academy of Arts Sciences’ Humanities Indicators Project.
Faculty Tenure Decisions and New Hires in HDS-1 Departments
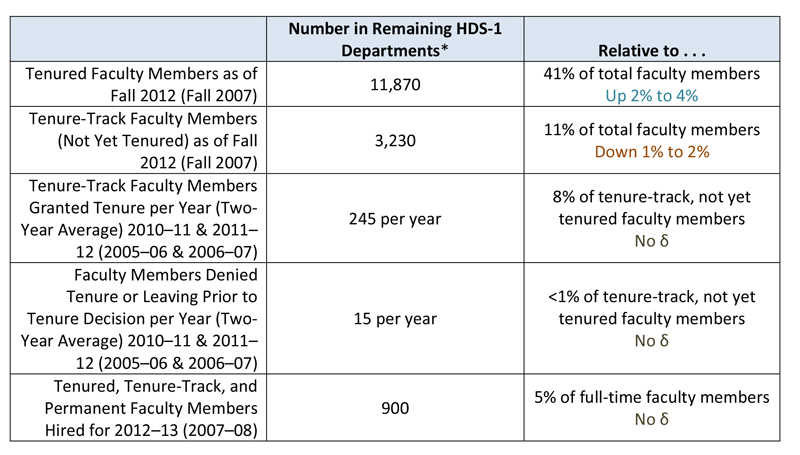
* These values should not be compared directly with 2007 data since these data do not include any departments that have been created in the interim. These data can be interpreted as estimates of minima for all 2012–13 departments combined.
Source: Susan White, Raymond Chu, and Roman Czujko, The 2012–13 Survey of Humanities Departments at Four-Year Institutions (College Park, MD: Statistical Research Center, American Institute of Physics, 2014). Study conducted for the American Academy of Arts Sciences’ Humanities Indicators Project.
Source: Susan White, Raymond Chu, and Roman Czujko, The 2012–13 Survey of Humanities Departments at Four-Year Institutions (College Park, MD: Statistical Research Center, American Institute of Physics, 2014). Study conducted for the American Academy of Arts Sciences’ Humanities Indicators Project.
The 95% confidence interval for the change in average per department from 2007 data is provided in italics; the width of the interval indicates the uncertainty in the estimate. “No δ” indicates any change exhibited is not statistically significant.
Availability of Institutional or Departmental Support for Research in HDS-1 Departments, Fall 2012
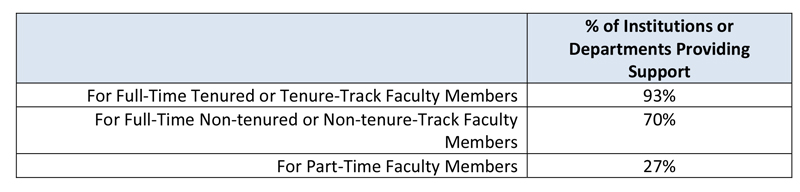
Source: Susan White, Raymond Chu, and Roman Czujko, The 2012–13 Survey of Humanities Departments at Four-Year Institutions (College Park, MD: Statistical Research Center, American Institute of Physics, 2014). Study conducted for the American Academy of Arts Sciences’ Humanities Indicators Project.
HDS-1 English Departments Offering Online Courses by Carnegie Classification and Form of Control, 2011–12 Academic Year
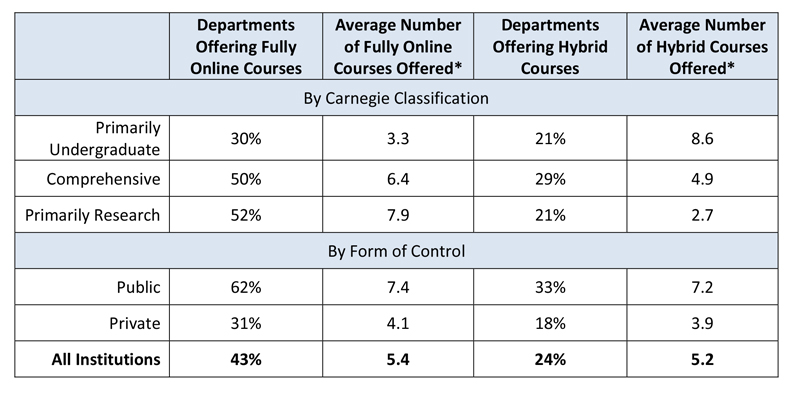
*Includes only departments that offer these courses.
Source: Susan White, Raymond Chu, and Roman Czujko, The 2012–13 Survey of Humanities Departments at Four-Year Institutions (College Park, MD: Statistical Research Center, American Institute of Physics, 2014). Study conducted for the American Academy of Arts Sciences’ Humanities Indicators Project.
Source: Susan White, Raymond Chu, and Roman Czujko, The 2012–13 Survey of Humanities Departments at Four-Year Institutions (College Park, MD: Statistical Research Center, American Institute of Physics, 2014). Study conducted for the American Academy of Arts Sciences’ Humanities Indicators Project.
Engagement with Digital Humanities by Carnegie Classification and Form of Control in HDS-1 Departments as of Fall 2012
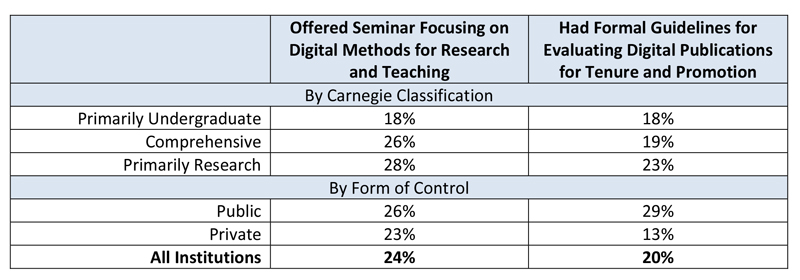
Source: Susan White, Raymond Chu, and Roman Czujko, The 2012–13 Survey of Humanities Departments at Four-Year Institutions (College Park, MD: Statistical Research Center, American Institute of Physics, 2014). Study conducted for the American Academy of Arts Sciences’ Humanities Indicators Project.
Information on this site is meant to be used and shared. Feel free to copy, distribute, and transmit text and images from the Humanities Indicators, with attribution.
