Chapter 3: On the Economic Consequences of Index-Linked Investing
Jeffrey Wurgler
A market index summarizes the performance of a group of securities into one number.1 The use of stock market indices in particular has been growing exponentially for years. Since Charles Dow introduced his indices in 1884, the number of distinct stock market indices reported in The Wall Street Journal has increased roughly 5 percent per year, as shown in Figure 1. Today’s Journal reports not just the Dow Jones Industrial Average (DJIA) and the S&P 500; it also reports on the Turkey Titans 20 and the Philadelphia Stock Exchange Oil Service Index. Markets are being tracked in more and more detail, and Figure 1 suggests that there is no end in sight.2
Figure 1: Number of Stock Market Indices Reported in The Wall Street Journal
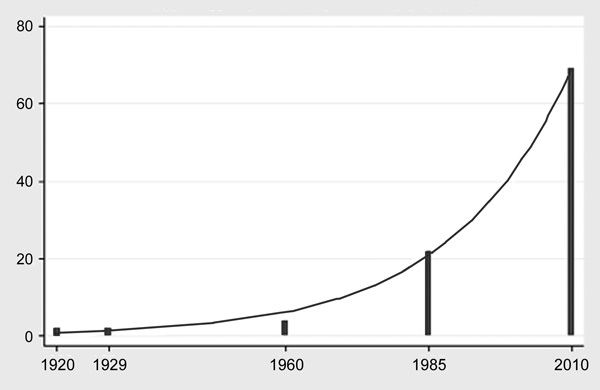
Data are for five selected years and fit to an exponential curve. Counts include both domestic and international indices. Source: Figure based on author’s own analysis.
The proliferation of indices reflects their ever-growing importance to the investment industry. Trillions of dollars are managed with some connection to an index, with the S&P 500 and MSCI World being among the most popular equity indices. Institutional investors often ask a fund manager to beat a particular index. Individuals may wish to match one via an index fund. Hedgers, speculators, and fund managers may manage exposure to index members through index derivatives. While I focus on stock markets in this essay, indices and associated investment products have proliferated also in debt markets, commodities, currencies, and other asset classes.
It is time to reflect on the broader economic consequences of these trends. I define index-linked investing as investing that focuses on a predefined and publicly known set of stocks. Here, I review some evidence that indices are no longer mere carriers of information, but that they and their associated index linked investing strategies have become so popular that they are generating new stock market phenomena in their own right. Because so many economic decisions are tied to stock prices, these phenomena affect the real economy.
For the sake of balance, I should start by acknowledging the many considerable benefits that indices and index-linked investment products provide. They allow managers and investors to calculate “betas” for cost of capital calculations and to learn from the information that indices contain about investment opportunities. Policy-makers use indices as forward-looking indicators of economic conditions.3 And, most obviously, investors have greatly benefited from these innovations. Index funds generally have lower expenses and costs than actively managed funds. They provide exposure to specific diversified portfolios, including portfolios of international stocks that would otherwise be difficult to construct and, for those delegating investment management, to monitor. Their core strategy tends to minimize distributions and thus is relatively tax efficient.
No doubt, indices and associated investment products are innovations that on the whole have benefited many individuals and institutions. On the other hand, their popularity has created underappreciated side effects. As I discuss below, these effects all stem from the finite ability of stock markets to absorb index-shaped demands for stocks. Not unlike the life cycles of some other major financial innovations, the increasing popularity of index-linked investing may well be reducing its ability to deliver its advertised benefits while at the same time increasing its broader economic costs.
INDEXING, INDEX FUNDS, AND STOCK PRICES
Indexed Assets Under Management (AUM)
As Figure 1 suggests, the importance of index-based investing strategies has risen rapidly. Index-based products now form a well-established segment of the investment management industry. The practitioner-oriented Journal of Indexes is over ten years old, as is an industry conference known as The Super Bowl of Indexing.
Huge sums are involved. As of this writing, Standard & Poor’s reports that there is $3.5 trillion benchmarked to the S&P 500 alone, including $915 billion in explicit Index funds. Exchange-traded funds (ETFs) now amount to $1 trillion across all asset classes and indices. Russell Investments estimates that $3.9 trillion is currently benchmarked to its indices. Together, these numbers quickly add up to about $8 trillion in easily countable products.
Active managers must also make distinctions between index and non-index members. Given tracking error concerns, an active manager who is bench-marked to an index is more likely to trade the stocks in that index, as well as associated liquid ETFs or index futures when equitizing inflows.4 For example, suppose a benchmarked manager forecasts that both an index member and a non-index member will appreciate 2 percent. He favors buying (or overweighting) the index member, all else equal, because it reduces tracking error. If the forecasts are -2 percent, he favors selling or shorting the non-index member on the margin. The very language of outperform and underperform implies a benchmark.
It is impossible to determine the exact dollar value of U.S. equities whose ownership and trading are somehow tied to indices, but the above suggests that the relevant numbers are in the trillions of dollars. This estimate means that every trading day, billions of dollars in net flows affect index members but not non-members. That this trading affects index members’ share prices is not surprising.
Index Inclusion Effects
A stock is deleted from the S&P 500 when it falls below a threshold liquidity or is delisted, acquired, or otherwise determined by the S&P Index Committee to have become sufficiently less representative of the market than the next available candidate.5 There are typically twenty or twenty-five changes to the Index in an average year. The press releases announcing the changes state that the inclusion of a stock is based not on any judgment as to investment merits but largely on liquidity and market representativeness; the lone requirement relating to economic fundamentals is four quarters of as-reported positive earnings, a simple piece of public information. The fact that Index inclusions are not associated with fundamental news allows for unusually clean estimates of the effect of demand per se on prices, which is the key question in light of the massive daily net flows faced by Index members.
The S&P 500 Index is a capitalization-weighted index.6 The percentage of each member that is held by explicitly Index-matching funds is therefore $915 billion in total Index fund assets divided by the $10.5 trillion total capitalization of the constituents (S&P estimates). This implies that, around the time of this writing, 8.7 percent of each stock that is newly added to the Index must be bought by Index fund managers—and rather quickly so, because their mandate is to replicate the Index. Whether they buy at a price that is “too high” is irrelevant.
On average, stocks that have been added to the S&P between 1990 and 2005 have increased almost 9 percent around the event, with the effect generally growing over time with Index fund assets.7 Stocks deleted from the Index have tumbled by even more. Given that mechanical indexers must trade 8.7 percent of shares outstanding in short order—and an even higher percentage in terms of the free float (not to mention the significant buying associated with benchmarked active management)—this price jump is easy to understand and, perhaps, impressively modest.
The obvious explanation for this jump is simple supply and demand. The argument could be made that one component of the price jump is due to expected increases in liquidity (an impact distinct from fundamentals of the firm). However, changes in volume, quoted spreads, and quoted depth are much smaller than would justify a price increase of several percentage points. After all, the S&P selected these stocks in part because of their high liquidity.
Index inclusion or weighting effects have been documented for the S&P SmallCap 600, the Russell 1000 and 2000, the Toronto Stock Exchange 300, Nikkei 225, MSCI country indices, and other indices. It is worth pointing out that there are notable price impacts even when the reweighting episode is unambiguously informationless: for example, the Russell indices’ changes are highly predictable, and the TSE 300 reweighting change studied by Kaul, Mehrotra, and Morck was perfectly predictable.8 The same broader economic issues that arise in connection with the S&P 500 may therefore also arise, to some extent, in international markets.
Comovement and Detachment
If a one-time inclusion effect of a few percentage points were the end of the story, then the overall impact of indexing on prices would be modest. But the inclusion effect is just the beginning. The return pattern of the newly included S&P 500 member changes magically and quickly. It begins to move more closely with its 499 new neighbors and less closely with the rest of the market. It is as if it has joined a new school of fish. Figure 2 illustrates the phenomenon. It is worth repeating that this pattern is occurring in some of the largest and most liquid stocks in the world.9
Figure 2: Changes in Comovement Patterns of Stocks Added to the S&P
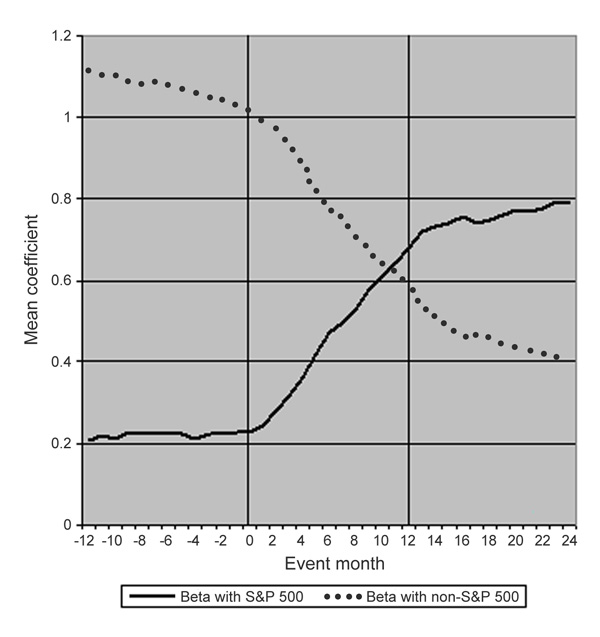
Results of a bivariate regression with daily returns of stocks added to the S&P 500 against the S&P 500 Index and the return on the rest of the market. Rolling twelve-month coefficients are computed for each added firm and the averages are plotted. The sample includes 153 stocks added to the S&P 500 between 1988 and 2000. Source: Nicholas Barberis, Andrei Shleifer, and Jeffrey Wurgler, “Comovement,” Journal of Financial Economics 75 (2005): 283–317.
These comovement patterns are where the real economic impact starts. Just as the initial price jump results from sudden index fund demand for the new stock, the increased comovement with other members of the S&P 500 relates to the highly correlated index fund inflows and outflows that they experience.10 To some degree, active managers with S&P benchmarks likely also contribute to this comovement, as discussed more below.
The net flows into index-linked products are both large and not perfectly correlated with other investors’ trades. Indexers and index-product users are, by definition, pursuing different strategies from those of the more active investor. They are less interested in keeping close track of the relative valuations of index and non-index shares. Some are index arbitrageurs or basis traders who care only about price parity between index derivatives and the underlying stock portfolio. The upshot is that over time, the index members can slowly drift away from the rest of the market, a phenomenon I call detachment.
This price detachment is not just a theoretical concern. In an important paper from 2001, Morck and Yang find evidence that S&P 500 Index members have enjoyed a significant and increasing price premium, most likely due to the growth of indexing. They match each stock within the Index as closely as possible to a stock outside the Index, where comparability is defined in terms of size and industry, and then compare their valuations. Figure 3 shows their results. As of 1997, they find an S&P membership price premium on the order of 40 percent.11
Figure 3: Valuation Detachment of S&P 500 Index Members, 1978–1997
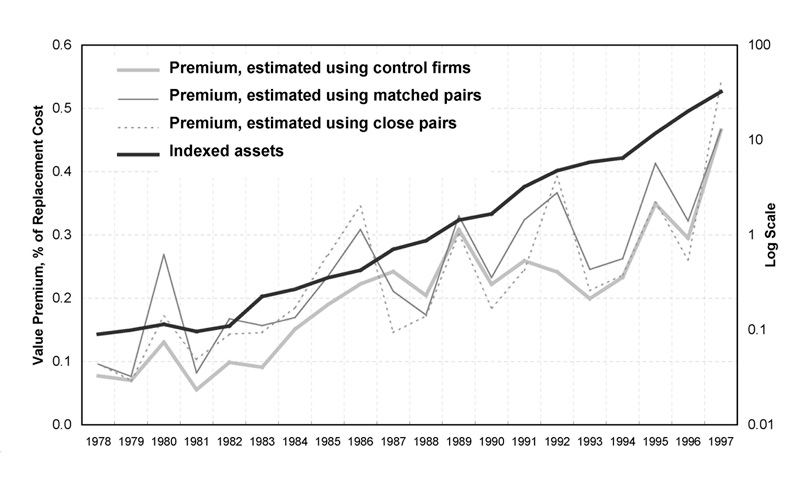
Vanguard 500 Fund assets in billions of 1982 dollars on the right axis, and membership valuation effect on the left axis. Valuations are measured as Tobin’s average Q. Source: Randall Morck and Fan Yang, “The Mysterious Growing Value of S&P Index Membership,” NBER Working Paper No. 8654, 2001. Figure reprinted here with permission from Morck and Yang.
This number is much higher than the inclusion and deletion effects noted above. Part of the gap may be due to the fact that professional fund managers are now widely aware of the inclusion effects and are increasingly predicting future changes, thereby attenuating announcement effects when they materialize.12 Alternatively, the full implications of Index addition may just take longer than a few days to materialize. For example, active managers may decide that the newly added stock, even after the inclusion effect, is still undervalued relative to other Index members, the newly natural comparison group.
Or perhaps Morck and Yang are simply overestimating the Index membership premium due to a subtle methodological problem. However, Cremers, Petajisto, and Zitzewitz reveal other evidence that the S&P 500 has detached over this period.13 They find that between 1980 and 2005, the S&P 500 generated eighty-two basis points of annual “alpha” relative to the Carhart four-factor model. Cumulated over time, this finding implies a smaller but still substantial Index membership premium.
The comovement and detachment effects are difficult to measure precisely. But even if Morck and Yang’s price premium estimate is too high by a factor of two, it would remain a large mispricing. Furthermore, there are reasons to suspect that Figure 2 may actually understate comovement distortions from index-based investing, because a number of indices’ membership lists overlap. Consider a stock that is already in the S&P 500 but is then added to the MSCI North America Index and consequently the popular MSCI World Index. Figure 2 would not capture the MSCI effect because the stock’s existing membership in the S&P had exaggerated its pre-addition comovement with all the other S&P stocks already in the MSCI indices.
In any case, the evidence is that stock prices are increasingly a function not just of fundamentals but also of the happenstance of index membership. This finding drives many of the negative consequences noted below.
Bubbles and Crashes
Investor reactions to index movements sometimes require increasing or decreasing exposure to the index, so feedback loops may arise. That is, shocks to prices lead to further demand, further shocks to prices, and further economic consequences. These cycles can operate at frequencies of both years and seconds.
One low-frequency loop involves simple return-chasing, and may be part of the story behind the Morck and Yang results. Indeed, they suggest that it is an “indexing bubble.” Return-chasing is a well-documented phenomenon in the literature on fund flows. The S&P 500 Index’s visibility and the easy access to ETFs and Index funds facilitate a high sensitivity of flows to returns.14 Active fund managers can face pressures to chase returns as well (including long-short investors), thereby limiting arbitrage forces that would otherwise reduce detachment.15 These effects are reinforced by the performance evaluation interaction that I discuss in more detail below: that is to say, the increasing popularity of indexing inhibits the ability of active managers to beat that index and make the case for their strategies. This returns-chasing feedback loop could be much of the story behind the S&P membership premium and the positive index alphas noted by Cremers and his colleagues.
Index membership also affects high-frequency risks, and may encourage trading activity that exacerbates those risks. Dramatic examples include the crash of October 19, 1987, and the intraday “flash crash” of May 6, 2010. SEC investigations have centered on S&P 500 derivatives in both cases.
The causes of the October 1987 crash are unknown, but it did not originate in any U.S. market.16 Nonetheless, some have argued that the shock propagated so quickly and dramatically due to a feedback loop involving portfolio insurance trades that used S&P Index futures to create synthetic puts:
The scenario is generally expressed as follows: An exogenous shock produces a stock market decline; that price decline triggers futures selling by portfolio insurers; such futures selling produces an undervaluing of the futures contract relative to the cash index; stock index arbitrageurs buy the relatively underpriced futures and sell the relatively overvalued stocks; stock prices fall further; declining stock prices induce additional selling by portfolio insurers; and the process begins anew.17
On October 19, S&P stocks declined an average of seven percentage points more than non-members of the same market capitalization.18 This is a clear and dramatic example of the high-frequency risk—again, a systematic risk— that index membership creates.
The flash crash of May 6, 2010, is again drawing attention to an index-based product. SEC investigations are ongoing, and no academic studies are available yet, but a prominent explanation involves S&P 500 e-mini Index futures. The story goes that a negative shock to S&P 500 prices or demand led to a large intraday price decline that was exacerbated by further selling in the futures, and so on. If this hypothesis is correct, the basic mechanisms that played a role in the October 1987 crash seem to be here still, twenty-three years later.
To be clear, these stories hardly suggest that the world would be better off without index derivatives. They simply raise the question of how differently these episodes would have unfolded in a counterfactual world where trading in index members is limited to their floating shares outstanding.
The Cross-Sectional Risk-Return Relationship
The basic proposition of asset pricing theory is the positive relationship between risk and expected return. Numerous models take a risk-averse marginal investor as a given and derive this as an equilibrium relationship. It is an intuitive and appealing proposition that is taught both as a normative principle and often, at least implicitly, as a descriptively accurate one.
It is surprising that more investors, teachers, and students are not aware that within the stock markets, this proposition has been incorrect. High-risk stocks have, on average, delivered lower returns than low-risk stocks in both U.S. markets and those around the world.19 Illustrative results for U.S. stocks are plotted in Figure 4. A $1 investment in a low beta portfolio in 1968 grows to $60.46 by 2008, while the same investment in a high beta portfolio yields $3.77. The high beta portfolio actually has a negative real return; the 2008 portfolio adjusted for inflation is worth $0.64. Restricting to larger cap stocks does not significantly change the qualitative picture.20
Figure 4: Return on High- and Low-Beta Portfolios
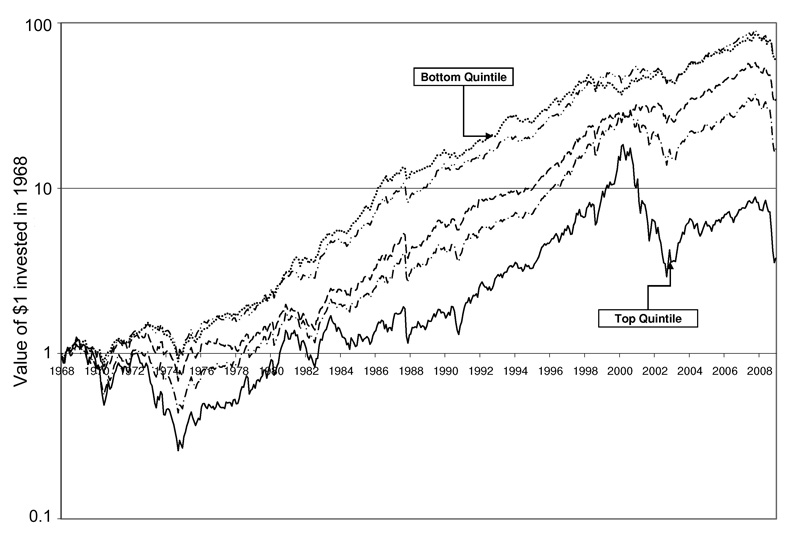
Each month, stocks are divided into quintiles according to trailing beta, where beta is estimated using up to sixty months of returns. In January 1968, $1 is invested, according to capitalization weights. At the end of each month, each portfolio is rebalanced, with no transaction costs included. Source: Malcolm Baker, Brendan Bradley, and Jeffrey Wurgler, “Benchmarks as Limits to Arbitrage: Understanding the Low Volatility Anomaly,” Financial Analysts Journal 67 (2011).
Surprisingly, academics have turned attention to this spectacular anomaly only recently. I introduce the topic here because there is reason to believe that it is exacerbated by the practice of benchmarking professional investors, which in turn is facilitated by the popularity of certain indices. The SEC requires every mutual fund to report a benchmark in its prospectus, and almost all institutional products specify one. There are good reasons why investors like to use the MSCI World, S&P 500, Russell 2000, or another index as a benchmark.21 But Baker, Bradley, and Wurgler suggest that benchmarking may interfere with managers’ incentives to enforce the risk-return relationship.22
The problem is that managers benchmarked against a simple index will tend to favor high beta stocks. Suppose a long-only manager is benchmarked against the market portfolio and its expected excess return is 10 percent. Suppose the institutional manager finds a stock with beta of 0.75 that is underpriced against a standard CAPM benchmark with an alpha of 2 percent. The expected excess return on the stock is 9.5 percent. But even though this stock is underpriced, the manager expects it to underperform the benchmark by 0.5 percent. In other words, for a manager benchmarked against the market portfolio, a stock with an alpha of 2 percent can be a candidate for underweighting. A similar argument shows that such a manager is also incentivized to overweight a low or negative alpha, high beta stock, unless the alpha is extremely negative.23 Put differently, maximizing the so-called information ratio, which puts excess returns against a benchmark in the numerator (and tracking error in the denominator), is a different objective function than maximizing the Sharpe ratio, which has excess returns over the riskless rate in the numerator.
The bottom line is that many of the investors that have enough sophistication and capital to potentially correct the anomaly are handcuffed by their mandates. These incentives may well make the risk-return anomaly worse. Figure 4 does suggest that the anomaly has not diminished over time. It may even have grown a bit with the trend toward increased institutional ownership.
ECONOMIC CONSEQUENCES
The mispricings noted above would be a sideshow put on by the stock market if stock prices did not affect so many real economic decisions. Every decision that depends on stock prices is therefore distorted by mispricing. Below, I review some such decisions faced by corporate managers and some faced by investors.
Corporate Investment and Financing
There are a number of ties between the stock market and corporate investment policy. A familiar mechanism that links indexing to investment decisions is the calculation of market betas for inputs to the CAPM. Although the model is empirically inaccurate, indeed backward, it nonetheless continues to be taught to students and widely used in practice. A survey found that 73.5 percent of CFOs use that model in capital budgeting.24
What are the consequences for real investment? The (equal-weighted) average stock added to the S&P 500 sees its beta increase by 0.10. With a market risk premium of 10 percent, the CAPM implied cost of equity for the average addition rises by 1 percent. Managers of these firms will find that fewer projects are positive NPV. This is ironic, given anecdotal evidence that managers are generally delighted at S&P 500 inclusion in part because they believe it improves access to capital markets.
Another effect on the cost of capital works through credit scoring models. These models place market valuations at the center; the greater the equity valuation, the greater the distance to default. This effect appears in Moody’s KMV model, the Merton model, and Altman’s Z-score.25 Debt financing is more important than equity, especially for large firms, suggesting the price premium associated with S&P 500 membership in Figure 3 is again likely to affect corporate investment. Here, the direction of the investment effect is time-varying; it depends on whether Index members are at a premium or a discount.
Finally, stock market valuations affect corporate investment from an (average) Tobin’s Q channel, where they are used as proxies for the profitability of investment. Like the credit risk effect, this mechanism induces a time-varying effect on investment that depends on the prevailing valuations of Index members.
Massa, Peyer, and Tong were the first to examine some of these predictions.26 They find that new S&P 500 inclusions increase their rate of equity issuance and reduce their leverage. Greater effects occur among firms that jumped more when they were initially included. The cost of equity is notoriously hard to measure, but the authors argue that reduces the cost of equity, driving the equity issuance results. These results do not support the beta-increase channel noted above. They are consistent with the credit scoring and Tobin’s Q channels in the context of S&P membership.
Investor Decisions
Index-driven mispricings affect expected returns and volatility. They also degrade investors’ ability to measure fund manager skill.
Investing in Index Funds. A main selling point for index funds has been comprehensive, low-cost diversification. The S&P 500 Index’s detachment means, however, that it is reflecting less and less the performance of the full stock market. Index funds based on the more comprehensive Wilshire 5000 (which has included as many as 7,200 stocks) are now providing more robust diversification and stock market exposure.
Not only are index fund owners experiencing extra risk in the form of low-frequency detachment, index-based trading creates more risk at higher frequency. The reason is that it is a focal point for those who want to change their stock market exposure in a hurry. For an index fund investor, reallocating from a stock market index fund to a bond fund or cash involves two trades, rather than hundreds of individual stock sales. To the extent that investment managers regard index membership as shorthand for liquidity, additional trading pressure may be concentrated on members. “Index trader risk” could be seen as a particular form of noise trader risk; earlier, I discussed two dramatic crashes that may have included this risk.
Index funds can also have interesting expected returns properties that again may confuse rather than simplify portfolio choice. There are several possibilities.
Suppose the cap-weighted index starts with each stock at fundamental value. An i.i.d. mispricing shock would then lead the index fund investor to overweight overvalued stocks. As prices correct over time, this leads to a drag on performance for cap-weighted portfolios, potentially contributing to the observed long-term underperformance of cap-weighted indices relative to equal-weighted indices. Yet if there is an unknown distribution of mispricing in the starting portfolio, as is presumably the case, then we cannot make such a sweeping conclusion.27
A second and very different possibility is that the market tends to under-react to stock-specific news. This does appear to be a stylized fact. In this world, the cap-weighted portfolio’s automatic movement toward stocks with positive news shocks induces what might be considered an attractive portfolio tilt; to invest in the cap-weighted index is to pursue something resembling a large-cap momentum strategy.
A third plausible case involves the hypothesized indexing bubble. Figure 3 shows that S&P 500 Index members have been on a roll, but if they are overpriced then presumably this cannot last forever. If this is indeed a bubble, then to invest in the cap-weighted Index is to pursue a strategy resembling a large-cap growth and momentum strategy, at least before the bubble pops.
For the sake of completeness, I should mention the textbook case: that is, the market is informationally efficient, and therefore indexing by using a subset of the stock universe cannot, on average, be beaten. Unfortunately, the evidence does not support the blanket assumption of market efficiency (I wouldn’t write this paper if it did), leaving all the other messy, non-mutually exclusive possibilities.
Clearly, the line between passive and active investment is blurrier than usually presented. In a world of inefficient markets—apparently, our world— to invest in a cap-weighted index is implicitly to assume an investing strategy and take a view on the predictability of stock returns. Ambiguity about what cap-weighted indexing represents complicates the would-be passive investor’s portfolio decision.28
The good news is that there are opportunities for the sophisticated investor. Cross-sectional risk-return inversion provides an attractive investment opportunity. Institutional mandates that are flexible enough to capture this include maximum Sharpe ratio, minimum volatility, and absolute returns. The lack of clear benchmarks reduces transparency and accountability, though. Pension and endowment funds would find it more difficult to keep track of aggregate risk exposures.
Performance Evaluation. Finally, index detachment makes it harder to evaluate investment managers. If index members are moving as a separate category, using them as a yardstick to measure a manager’s skill is problematic.29 Performance relative to the index becomes period-specific: the likelihood of beating the index depends on which way the detached index members happened to move relative to non-members.
If there was an indexing bubble, then the associated high benchmark returns have created a headwind for active managers for decades. Indeed, as noted above, the S&P 500 did have “alpha” relative to common expected return models over the 1980 to 2005 period in which indexed assets exploded.
The popularity of indexing may not be simply a reflection of the fact that active managers are unable, on average, to beat the index; it may actually be contributing to their underperformance. Likewise, if the indexing bubble pops, or even springs a slow leak, even many low-skilled active managers will outperform the benchmark, and the popularity of indexing may wane. In a world with substantial index detachment, estimates of the relative alpha-generating skill across managers are still possible, but absolute statements about even the average fund manager’s skill are quite tenuous.
LOOKING FORWARD
Indices and index-based trading are innovations that have not come for free. The economic implications are not well researched, and some are inherently difficult to measure, but they no doubt exist to some extent and are likely to grow in accord with the growth of index-based investing.
What are the policy implications? There may be none. There is no practical way to redeploy the trillions of dollars now indexed in a way that reduces their economic consequences. But we can at least consider a variety of thought experiments that involve small reforms.
A mass shift to the use of broader market indices would mitigate some of the problems discussed here. As of this writing, the S&P 500 represents about 78 percent of total U.S. market capitalization, so the risk reductions from a hypothetical mass shift to, say, the Wilshire 5000 (assuming the wish to retain a U.S. focus) would not be overwhelming. Mid-caps and small-caps do diversify a large-cap portfolio, however. Furthermore, if the S&P 500 membership price premium is as large as Morck and Yang suggest, 78 percent of total market cap overstates the proper weight of the S&P. If the Index lost its putative 30 percent premium, for example, then its corrected share of the market would be closer to 60 percent. This outcome would imply greater benefits to a mass move to a broader index.
Yet even this modest suggestion has some problems. At some point, the marginal firm is too small to handle its share of net flows without large price impacts. Adding mid-caps and smaller-caps to the mix would also destroy some of their current diversification benefits via comovement increases, and perhaps adversely affect the capital budgeting decisions of the new inclusions. The optimal breadth for a single U.S. stock market index, from the perspective of overall benefits and costs to all those affected by stock prices, is probably more than (most of) the largest five hundred stocks but fewer than the largest five thousand. As the markets grow, so, too, would this optimal breadth.
Practically speaking, the interest in new cap-weighted indices may be approaching certain limits. With more than twenty thousand readily investable equities worldwide, there are, in principle, over 220,000 sets of securities that could be assembled, which is far greater than the number of atoms in the universe. But the number of U.S. indices reported in The Wall Street Journal in Figure 1 has plateaued at around twenty; international market indices make up most of the recent growth. Apparently, the U.S. market has been carved up as much as most Journal readers need.
The frontiers of index definition involve new combinations of weighting schemes, geographical areas, and industries. One interesting development is the introduction of so-called fundamental indexing strategies, in which holdings are weighted by variables such as dividend yield rather than market capitalization. These strategies are sometimes promoted under the claim that capitalization-weighted indices are generally overweight overvalued stocks. While that claim is flawed (as I have discussed), these strategies do represent a novel approach to active investing and may stimulate informative new indices.
Indices and index-based investing are innovations that are here to stay; they have become central to modern investing, and rightly so. The consequences are here to stay as well. Research on the magnitude of the economic distortions they cause is needed, as are suggestions about how regulators and market structures might reduce them.
ENDNOTES
12. Petajisto, “The Index Premium and Its Hidden Cost for Index Funds.”
22. Baker, Bradley, and Wurgler, “Benchmarks as Limits to Arbitrage.”