Section 1: An Overview of State Funding for Higher Education
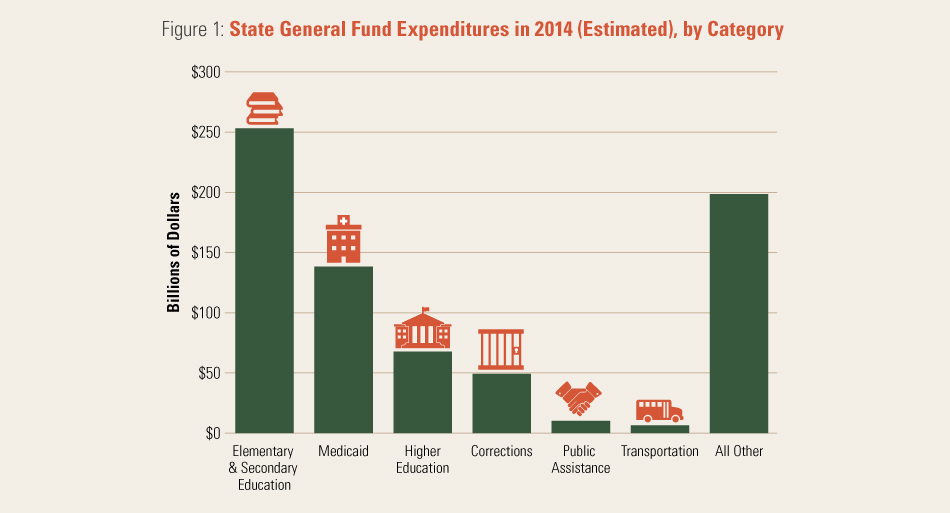
Higher Education is the third-largest spending area in the typical state budget. In this figure, “All Other” is defined as expenditures from revenue sources that are restricted by law for particular governmental functions or activities. Source: National Association of State Budget Officers, State Expenditure Report: Examining Fiscal 2012–2014 State Spending (Washington, D.C.: National Association of State Budget Officers, 2015). See also State Higher Education Executive Officers (SHEEO) Association, SHEF: FY 2014—State Higher Education Finance (Boulder, Colo.: State Higher Education Executive Officers Association, 2015); State Higher Education Executive Officers Association and Illinois State University Center for the Study of Education Policy, “Grapevine Compilation of State Fiscal Support for Higher Education, Fiscal Year 2014–2015,” http://education.illinoisstate.edu/grapevine/; National Center for Education Statistics, IPEDS [Integrated Postsecondary Education Data System] (U.S. Department of Education, Institute of Education Sciences), https://nces.ed.gov/ipeds/; and David A. Tandberg and Casey Griffith, “State Support of Higher Education: Data, Measures, Findings, and Directions for Future Research,” in Higher Education: Handbook of Theory and Research, vol. 28, ed. Michael B. Paulsen (Dordrecht: Springer Netherlands, 2013), 613–685, http://link.springer.com/10.1007/978-94-007-5836-0_13.
Higher education has been described as the “balance wheel” of state budgets: state appropriations for higher education tend to rise disproportionately when the economy is strong, and fall disproportionately when the economy is weak.
Three observations support this argument: 1) Unlike state agencies, higher education institutions have separate budgets, reserves, and revenue streams (tuition and fundraising), and therefore possess a perceived capacity to absorb cuts; 2) Higher education institutions have a greater capacity to cut or slow the growth of employee pay in bad times, or raise it in good times, because they are not bound by statewide pay scales; and 3) Higher education institutions can vary program elements, such as course offerings and class sizes, and therefore associated spending, in ways that may be difficult for state agencies.
Since public higher education is perceived as a relatively flexible budget item—a rarity among the proliferating mandatory spending programs that dominate state budgets—each institution contends separately with unpredictable funding patterns, a volatility that has a profound impact on their operations. This volatility complicates long-term planning and may reduce their attractiveness as employers, since professors and other staff face greater uncertainty about their job security and long-term career prospects. And the inability to count on state funding leads to tuition increases at the very times when those increases are most difficult for students and their families to bear. Between 2008 and 2014, published public higher education tuition increased by 28 percent after adjusting for inflation. Tuition increased by more than 20 percent in twenty-nine states, more than 40 percent in ten states, and more than 60 percent in six states. Tuition in Arizona rose by 81 percent per student, after adjusting for inflation.5
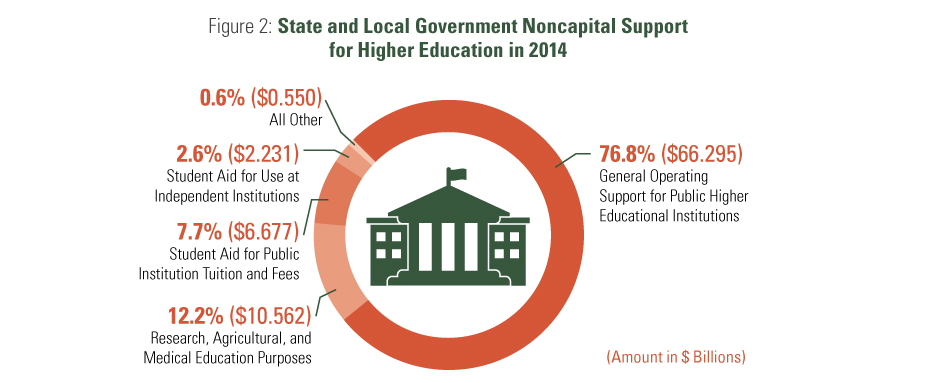 |
Source: State Higher Education Executive Officers (SHEEO) Association, SHEF: FY 2014—State Higher Education Finance (Boulder, Colo.: State Higher Education Executive Officers Association, 2015).
State Support for Higher Education (Both Public and Private Institutions) Outside of Normal Budgetary Appropriations:
There is no comprehensive tally for the cost of these loans and tax expenditures, but it is likely to be at least several billion dollars annually (based on review of selected state tax expenditure reports). |
A number of factors drive the variation in state spending on higher education (see Figure 3):
- Economic and demographic variables such as per capita income, the size of the college-age population relative to the total population (with a relatively greater college-age population associated with lower spending per student), and the proportion of students attending college out-of-state;
- Fiscal variables such as pressures to spend in other areas, particularly K–12 education and Medicaid; and
- Local, institutional factors such as the political parties of governors and legislative majorities, the demographic compositions of state legislatures, and tax and expenditure limits.6
 In
this report we focus primarily on spending per FTE student as an important measure
of the resources available per student, and of the potential consequences of cuts.
Governors and legislatures do not, of course, have the luxury of simply funding
a desired amount of spending per FTE student: they must make choices about how much
funding to provide for public priorities such as K–12 education, higher education,
corrections, and health care, in dollar terms. The amount needed or desired will
depend in part on whether the population involved is growing or shrinking—more or
fewer children in school, students in college, prisoners in prisons, and elderly
persons in nursing homes—but must fit into overall priorities. Except for
K–12 education, there is no universal access guarantee. While higher education
funding will not necessarily follow enrollment, spending per FTE student is a good
indicator of how overall changes in spending will affect students.
In
this report we focus primarily on spending per FTE student as an important measure
of the resources available per student, and of the potential consequences of cuts.
Governors and legislatures do not, of course, have the luxury of simply funding
a desired amount of spending per FTE student: they must make choices about how much
funding to provide for public priorities such as K–12 education, higher education,
corrections, and health care, in dollar terms. The amount needed or desired will
depend in part on whether the population involved is growing or shrinking—more or
fewer children in school, students in college, prisoners in prisons, and elderly
persons in nursing homes—but must fit into overall priorities. Except for
K–12 education, there is no universal access guarantee. While higher education
funding will not necessarily follow enrollment, spending per FTE student is a good
indicator of how overall changes in spending will affect students.
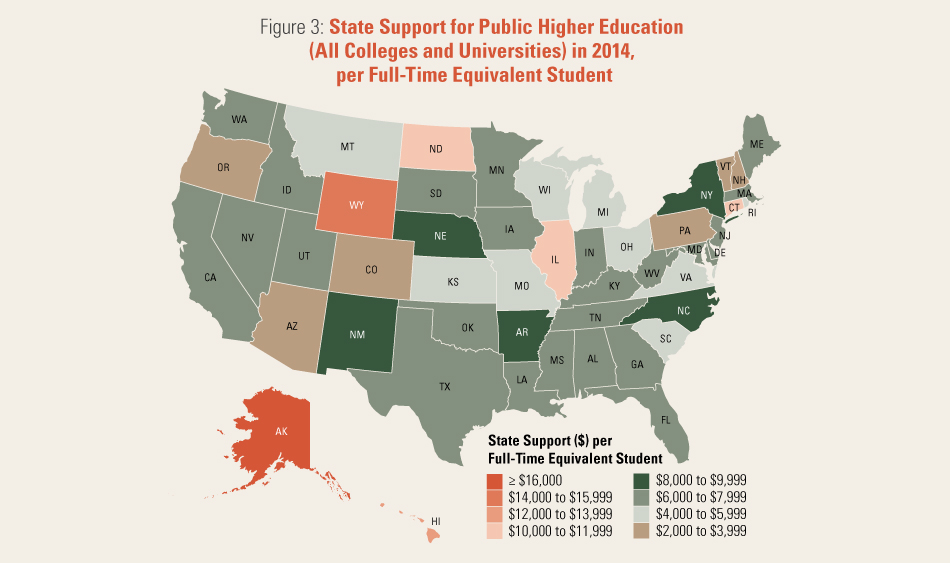
State support for public higher education per full-time equivalent student ranges from about $3,000 to over $18,000. Source: State Higher Education Executive Officers (SHEEO) Association, SHEF: FY 2014—State Higher Education Finance (Boulder, Colo.: State Higher Education Executive Officers Association, 2015).
ENDNOTES
5 Michael Mitchell, Vincent Palacios, and Michael Leachman, States are Still Funding Higher Education below Pre-Recession Levels (Washington, D.C.: Center on Budget and Policy Priorities, 2014), http://www.cbpp.org/research/states-are-still-funding-higher-education-below-pre-recession-levels; and Michael Mitchell and Michael Leachman, Years of Cuts Threaten to Put College Out of Reach for More Students (Washington, D.C.: Center on Budget and Policy Priorities, 2015), http://www.cbpp.org/research/state-budget-and-tax/years-of-cuts-threaten-to-put-college-out-of-reach-for-more-students.
6 For recent reviews of research on this topic, see Jennifer A. Delaney and William R. Doyle, “State Spending on Higher Education: Testing the Balance Wheel over Time,” Journal of Education Finance 36 (4) (2011): 343–368; Jennifer A. Delaney and William R. Doyle, “The Role of Higher Education in State Budgets,” in State Postsecondary Education Research: New Methods to Inform Policy and Practice, ed. Kathleen M. Shaw and Donald E. Heller (Sterling, Va.: Stylus Publishing, 2007); and Michael K. McLendon, James C. Hearn, and Christine G. Mokher, “Partisans, Professionals, and Power: The Role of Political Factors in State Higher Education Funding,” The Journal of Higher Education 80 (6) (2009): 686–713, doi:10.1353/jhe.0.0075.
7 National Conference of State Legislatures, “Saving for College: 529 Plans,” May 22, 2014, http://www.ncsl.org/research/education/saving-for-college-529-plans.aspx.