Appendix: State Spending on Public Higher Education per Full-Time Equivalent Student Varies by More than Sixfold
State support for public higher education in 2014 ranged from more than $18,000 per FTE student in Alaska to about $3,000 per FTE student in New Hampshire, a sixfold difference (see Figure 3). While Alaska and New Hampshire are often extremes on fiscal measures, the differences between less polar states were still quite large. Connecticut, the fifth-highest spending state, spent three times as much per FTE student as did Vermont, the fifth-lowest spending state; and North Carolina, the tenth-highest spending state, spent 74 percent more than did Wisconsin, the tenth-lowest spending state.
The variation in state appropriations for higher education means that states also vary greatly in their relative reliance on appropriations versus net tuition. Alaska and Wyoming, which provide very high state support for public higher education, rely relatively little on net tuition. New Hampshire and Vermont, which provide relatively little state support for public higher education, rely heavily on net tuition revenue.
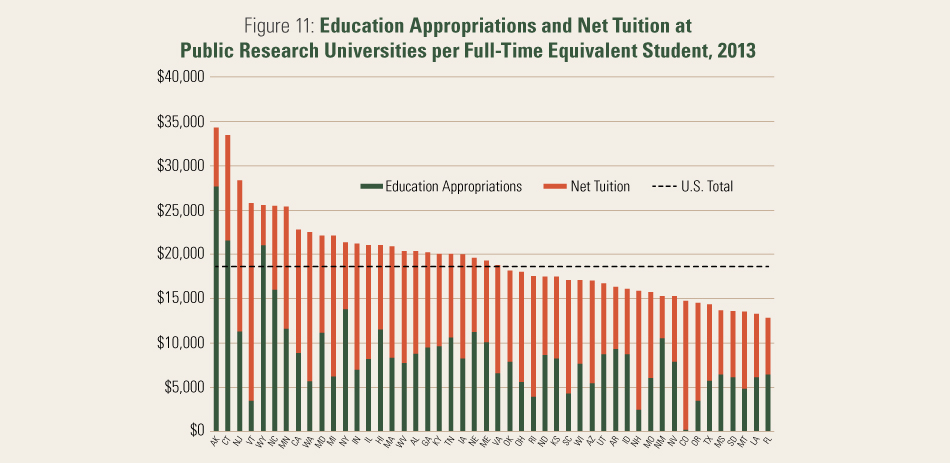
States vary in their reliance on appropriations and net tuition. Source: State Higher Education Executive Officers (SHEEO) Association, SHEF: FY 2014—State Higher Education Finance (Boulder, Colo.: State Higher Education Executive Officers Association, 2015).
The relationship between education appropriations and net tuition also reflects state philosophies and policies about who should pay the costs of higher education. For example, New Mexico, which has a relatively high appropriation share, has a policy of keeping tuition low to allow a large number of students to participate. Vermont, by contrast, prefers to keep tuition higher for those who can afford college and provides significant financial assistance for those who cannot.25
How have changes in state support affected individual public university systems, and how have these institutions responded?
California
 “Prior to 2010–11, state funding was the largest single source of support for the
education function of the University. Over the past ten years, state educational
appropriations have fallen more than $1 billion in inflation-adjusted dollars despite
UC’s enrollment growth. State educational appropriations constituted only
9 percent of UC’s operating budget in 2012–13 compared to 23 percent in 2001–02.”26
“Prior to 2010–11, state funding was the largest single source of support for the
education function of the University. Over the past ten years, state educational
appropriations have fallen more than $1 billion in inflation-adjusted dollars despite
UC’s enrollment growth. State educational appropriations constituted only
9 percent of UC’s operating budget in 2012–13 compared to 23 percent in 2001–02.”26
Colorado
 “Colorado State this year [2011] received $94 million in funding from the
State of Colorado, a reduction of about $36 million over the past three years. Colorado
State has managed these state funding cuts by freezing hiring and salaries, reducing
expenses (with an emphasis on cuts to administration), and increasing student tuition.”27
“Colorado State this year [2011] received $94 million in funding from the
State of Colorado, a reduction of about $36 million over the past three years. Colorado
State has managed these state funding cuts by freezing hiring and salaries, reducing
expenses (with an emphasis on cuts to administration), and increasing student tuition.”27
New York
 In New York, the percent change in state educational appropriations per FTE student
from 2008 to 2014 is –11.1 percent, a decrease of $1,154 per student. To offset
these cuts, tuition has increased by $1,215 per FTE student (21.3 percent) in the
same six years.28
In New York, the percent change in state educational appropriations per FTE student
from 2008 to 2014 is –11.1 percent, a decrease of $1,154 per student. To offset
these cuts, tuition has increased by $1,215 per FTE student (21.3 percent) in the
same six years.28
Tennessee
 “In Tennessee, total appropriations remain below FY2008 levels. As a result,
in FY2015 there is no funding for general salary increases for state and university
employees, leading the state to lag in providing compensation at the market rate.
In order to maintain current operations and continue progress in supporting student
success and completion, the in-state maintenance fee will increase 6 percent, from
$9,780 to $10,366 for in-state students at the University of Tennessee, Knoxville.
It should be noted that the University of Tennessee continues to allocate additional
funding to student aid to keep the net cost of student fees as low as possible—expenditures
for institutional scholarships and fellowships grew by over 233 percent from FY2003
to FY2013.”29
“In Tennessee, total appropriations remain below FY2008 levels. As a result,
in FY2015 there is no funding for general salary increases for state and university
employees, leading the state to lag in providing compensation at the market rate.
In order to maintain current operations and continue progress in supporting student
success and completion, the in-state maintenance fee will increase 6 percent, from
$9,780 to $10,366 for in-state students at the University of Tennessee, Knoxville.
It should be noted that the University of Tennessee continues to allocate additional
funding to student aid to keep the net cost of student fees as low as possible—expenditures
for institutional scholarships and fellowships grew by over 233 percent from FY2003
to FY2013.”29
ENDNOTES
25 Julie Davis Bell, The Nuts and Bolts of the Higher Education Legislative Appropriations Process, Getting What You Pay For Policy Brief (Boulder, Colo.: National Conference of State Legislatures and Western Interstate Consortium for Higher Education, November 2008), http://www.wiche.edu/info/gwypf/bell_appropriations.pdf.
26 University of California, Accountability Report 2014 (Oakland: University of California Regents, 2015), “Chapter 12: University Finances and Private Giving,” http://accountability.universityofcalifornia.edu/2014/index/chapter/12.
27 Colorado State University, Financial Accountability Report: Fiscal Year 2011 Financial Highlights (Fort Collins: Colorado State University, 2012), 2, http://busfin.colostate.edu/finstmt/finacct11.pdf.
28 Mitchell, Palacios, and Leachman, States are Still Funding Higher Education below Pre-Recession Levels.
29 The University of Tennessee, Budget Document FY 2014–2015 (Knoxville: University of Tennessee System Budget Office, 2014), http://www.tennessee.edu/budget/docs/FY15_Proposed.pdf.