Trends in the Demographics of Humanities Faculty
Findings and Trends
- Given growing concern about humanities faculty members employed in “contingent” positions (off the tenure track or part-time), the survey asked departments for information on both forms of employment. In each of the disciplines surveyed, less than half of the faculty members were employed off the tenure track, but the percentages ranged from 19% of the faculty in history of science programs (which tended to be situated in specialized doctoral-level programs at research universities) to about 50% of the faculty in the communication discipline (Figure 1).
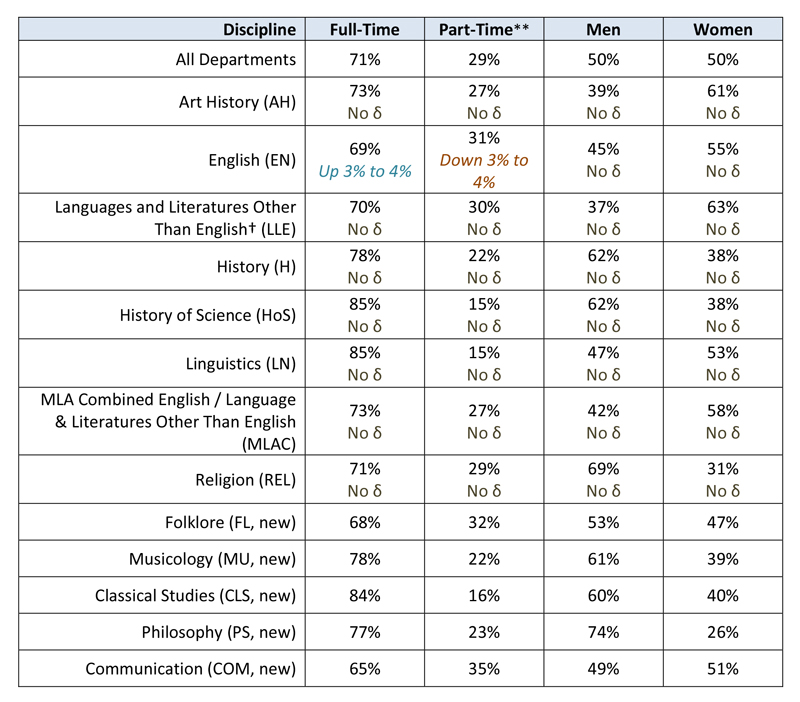
- Faculty employed part-time constituted less than a third of the faculty members in most of the disciplines surveyed (Figure 2). Again, the communication discipline appeared at the top of the range, with 35% of their faculty employed part-time.
- Contrary to expectations, given the effects of the recent recession and accompanying hiring freezes, the proportion of faculty working in contingent positions appeared to shrink slightly in comparison to the previous departmental survey. The only disciplines that experienced a statistically significant change from 2007 in the proportion of non-tenured/tenure-track faculty members were English (up 1–2 percentage points for those employed full-time and down 2–3 points for those employed part-time) and history (where the numbers were down 0–1 percentage points among those employed full-time and up 1–3 percentage points among those employed part-time).
- Overall, about three-fourths of the students in introductory undergraduate courses were taught by full-time faculty members, including tenured, tenure-track, and non-tenure-track faculty members, though this statistic does not tell us how many of the full-time faculty were supported by one or more teaching assistants (Figure 3).
- Most students (86%) in non-introductory undergraduate courses were taught by full-time faculty members.
- Students enrolled in a graduate English class or in a graduate history class were more likely to be taught by a full-time tenured or tenure-track faculty member than students in graduate classes in all other HDS-2 disciplines combined.
- About half of the faculty members teaching in humanities disciplines were women, but notable differences in faculty gender balance were observed among the humanities disciplines. Women comprised almost two-thirds of the faculty in languages and literatures other than English, but less than one-third of philosophy and religion faculty (Figure 4).
- In no discipline did the proportion of faculty members who were women change by a statistically significant amount from 2007 to 2012.
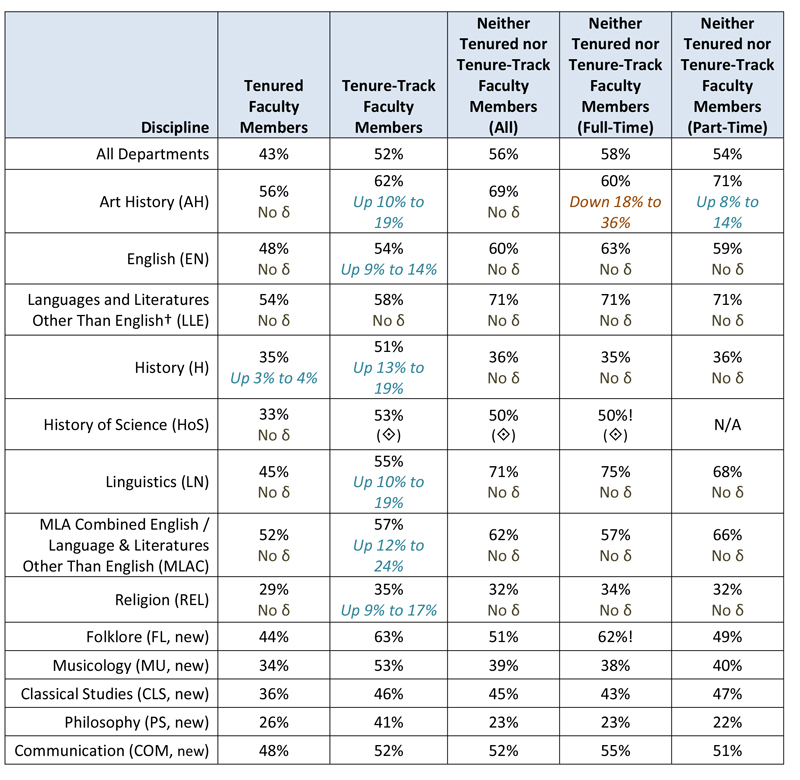
- Traditionally, women have been more heavily represented among faculty members in contingent faculty positions, and this survey found that still to be the case in some disciplines. In five of the 11 disciplines surveyed, the proportion of women employed in positions off the tenure track was 5 to 16 percentage points higher than among faculty employed on the tenure track (Figure 5). Notably, however, the fields with the lowest representation of women in their ranks (classical studies, history, musicology, religion, and philosophy) had a smaller proportion of women among their non-tenure-track faculty than among their faculty on the tenure track.
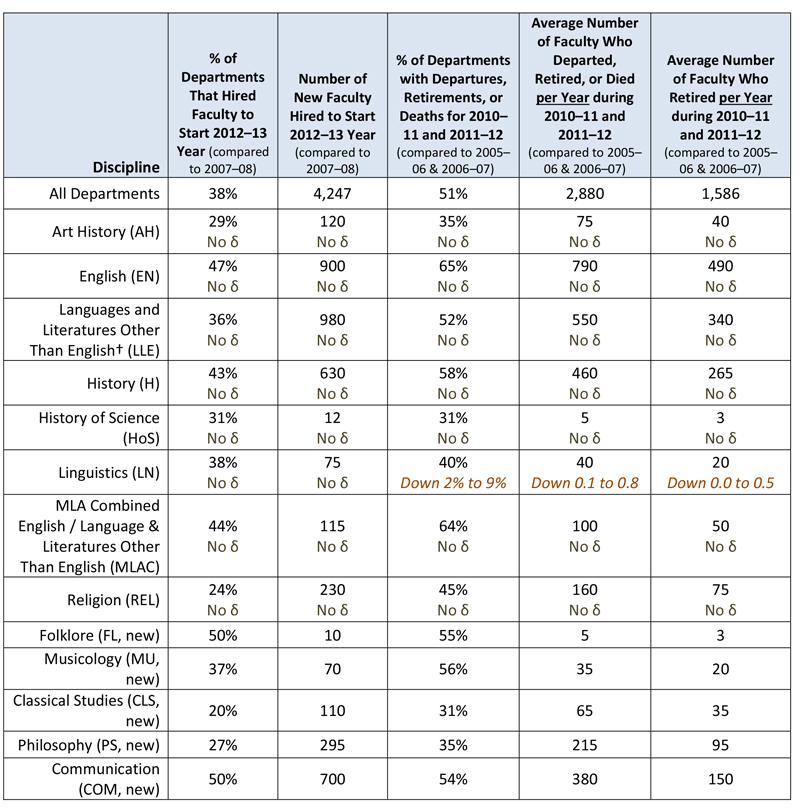
- The number of faculty hired into the departments and programs surveyed for the 2012–13 academic year was higher than the number of faculty lost, on average, in each of the two previous years (Figure 6). (Note that among disciplines included in the first study, only departments in the 2007 sample were included in the 2012 sample, so the number does not reflect data for departments created in the interim.)
- The average number of tenured, tenure-track, and permanent faculty members hired per department in 2007 was not significantly different from the average number hired per department in 2012 (for departments who responded to both surveys).
- In most of the responding disciplines, half or more of the departing faculty were retiring (rather than leaving their departments for other reasons, such as alternative job opportunities or a denial of tenure). The exceptions were religion, philosophy, and communication.
Faculty Distribution by Tenure Status, Fall 2012
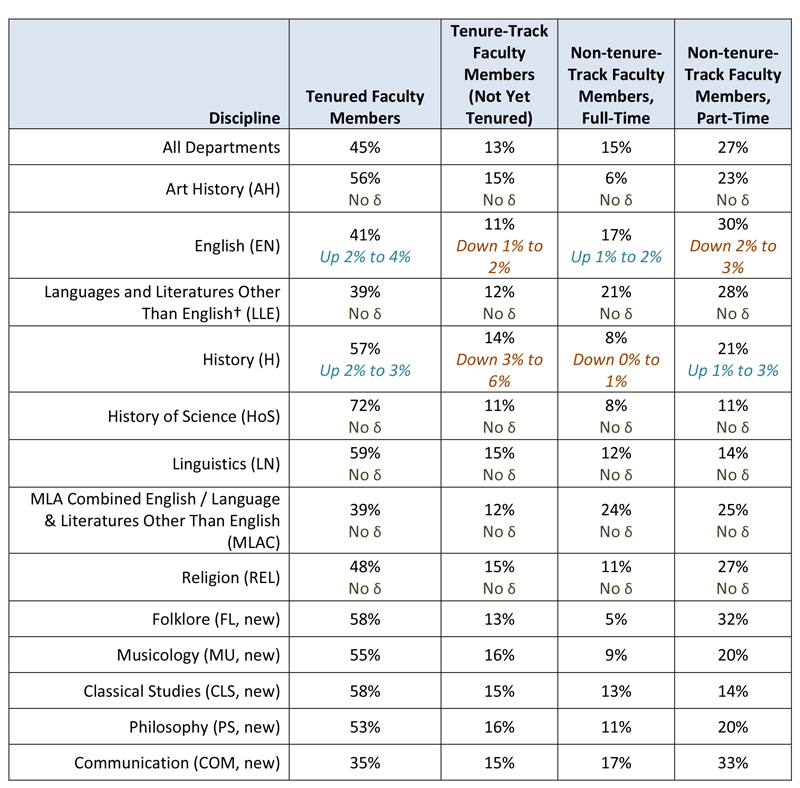
† Some of the departments classified as LLE for HDS-1 have been reclassified as CLS for HDS-2. Any comparisons are made using only departments classified as LLE for both HDS-1 and HDS-2.
Note: For the disciplines included in both HDS-1 and HDS-2, only those departments included in the 2007–08 sample are included in the 2012 sample. Thus, these numbers cannot reflect data for any departments that may have been created in the interim.
Source: Susan White, Raymond Chu, and Roman Czujko, The 2012–13 Survey of Humanities Departments at Four-Year Institutions (College Park, MD: Statistical Research Center, American Institute of Physics, 2014). Study conducted for the American Academy of Arts Sciences’ Humanities Indicators Project.
Faculty Distribution by Employment Status and Gender, Fall 2012
† Some of the departments classified as LLE for HDS-1 have been reclassified as CLS for HDS-2. Any comparisons are made using only departments classified as LLE for both HDS-1 and HDS-2.
Note: For the disciplines included in both HDS-1 and HDS-2, only those departments included in the 2007–08 sample are included in the 2012 sample. Thus, these numbers cannot reflect data for any departments that may have been created in the interim.
** Proportion of part-time faculty in Table 3 will not necessarily match that from Table 2 since some part-time faculty members are tenured or tenure-track. In Table 2, these are included in the tenured or tenure-track categories. In every case, the proportion shown as part-time in Table 2 should be less than or equal to that shown in Table 3.
Source: Susan White, Raymond Chu, and Roman Czujko, The 2012–13 Survey of Humanities Departments at Four-Year Institutions (College Park, MD: Statistical Research Center, American Institute of Physics, 2014). Study conducted for the American Academy of Arts Sciences’ Humanities Indicators Project.
The 95% confidence interval for the change in proportion per department from 2007 data is provided in italics; the width of the interval indicates the uncertainty in the estimate. “No δ” indicates any change exhibited is not statistically significant.
Representation of Women among Faculty, Fall 2012
† Some of the departments classified as LLE for HDS-1 have been reclassified as CLS for HDS-2. Any comparisons are made using only departments classified as LLE for both HDS-1 and HDS-2.
Note: For the disciplines included in both HDS-1 and HDS-2, only those departments included in the 2007–08 sample are included in the 2012 sample. Thus, these numbers cannot reflect data for any departments that may have been created in the interim.
! Interpret with caution; the standard error is more than 25% of the estimate.
Source: Susan White, Raymond Chu, and Roman Czujko, The 2012–13 Survey of Humanities Departments at Four-Year Institutions (College Park, MD: Statistical Research Center, American Institute of Physics, 2014). Study conducted for the American Academy of Arts Sciences’ Humanities Indicators Project.
Tenured, Tenure-Track, and Permanent Faculty Members Hired for 2012–13 and Departed for 2010–11 and 2011–12 Combined
† Some of the departments classified as LLE for HDS-1 have been reclassified as CLS for HDS-2. Any comparisons are made using only departments classified as LLE for both HDS-1 and HDS-2.
Note: For the disciplines included in both HDS-1 and HDS-2, only those departments included in the 2007–08 sample are included in the 2012 sample. Thus, these numbers cannot reflect data for any departments that may have been created in the interim.
Source: Susan White, Raymond Chu, and Roman Czujko, The 2012–13 Survey of Humanities Departments at Four-Year Institutions (College Park, MD: Statistical Research Center, American Institute of Physics, 2014). Study conducted for the American Academy of Arts Sciences’ Humanities Indicators Project.
The 95% confidence interval for the change in proportion per department from 2007 data is provided in italics; the width of the interval indicates the uncertainty in the estimate. “No δ” indicates any change exhibited is not statistically significant.
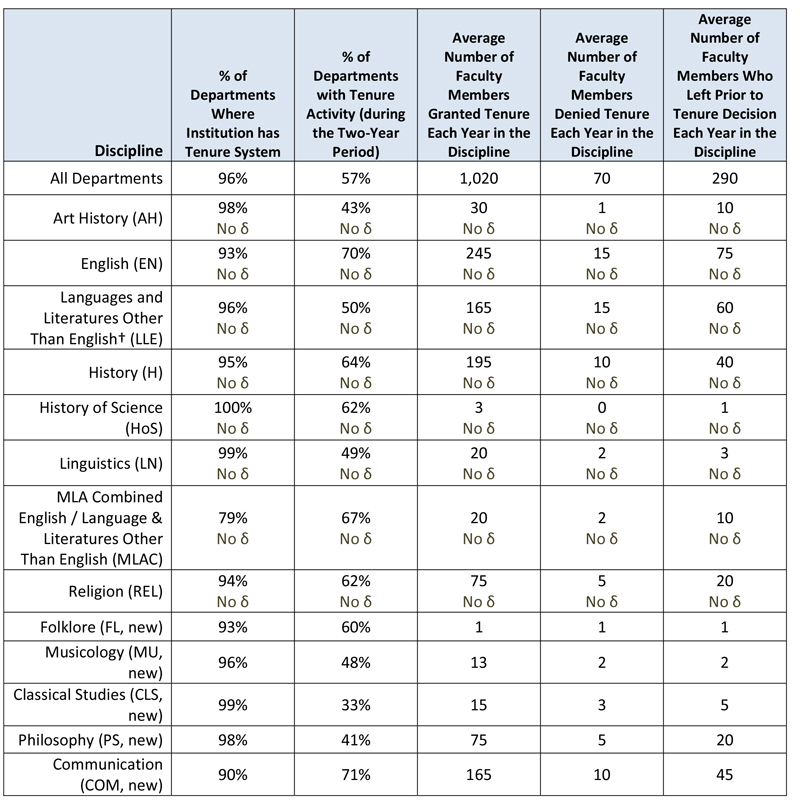
Tenure Activity over a Two-Year Period (2010–11 & 2011–12)
† Some of the departments classified as LLE for HDS-1 have been reclassified as CLS for HDS-2. Any comparisons are made using only departments classified as LLE for both HDS-1 and HDS-2.
Note: For the disciplines included in both HDS-1 and HDS-2, only those departments included in the 2007–08 sample are included in the 2012 sample. Thus, these numbers cannot reflect data for any departments that may have been created in the interim.
Source: Susan White, Raymond Chu, and Roman Czujko, The 2012–13 Survey of Humanities Departments at Four-Year Institutions (College Park, MD: Statistical Research Center, American Institute of Physics, 2014). Study conducted for the American Academy of Arts Sciences’ Humanities Indicators Project.
Note: For the disciplines included in both HDS-1 and HDS-2, only those departments included in the 2007–08 sample are included in the 2012 sample. Thus, these numbers cannot reflect data for any departments that may have been created in the interim.
Source: Susan White, Raymond Chu, and Roman Czujko, The 2012–13 Survey of Humanities Departments at Four-Year Institutions (College Park, MD: Statistical Research Center, American Institute of Physics, 2014). Study conducted for the American Academy of Arts Sciences’ Humanities Indicators Project.
The 95% confidence interval for the change in average or proportion per department from 2007 data is provided in italics; the width of the interval indicates the uncertainty in the estimate. “No δ” indicates any change exhibited is not statistically significant.
Instructor of Record for Introductory Undergraduate Courses, Fall 2012 Term
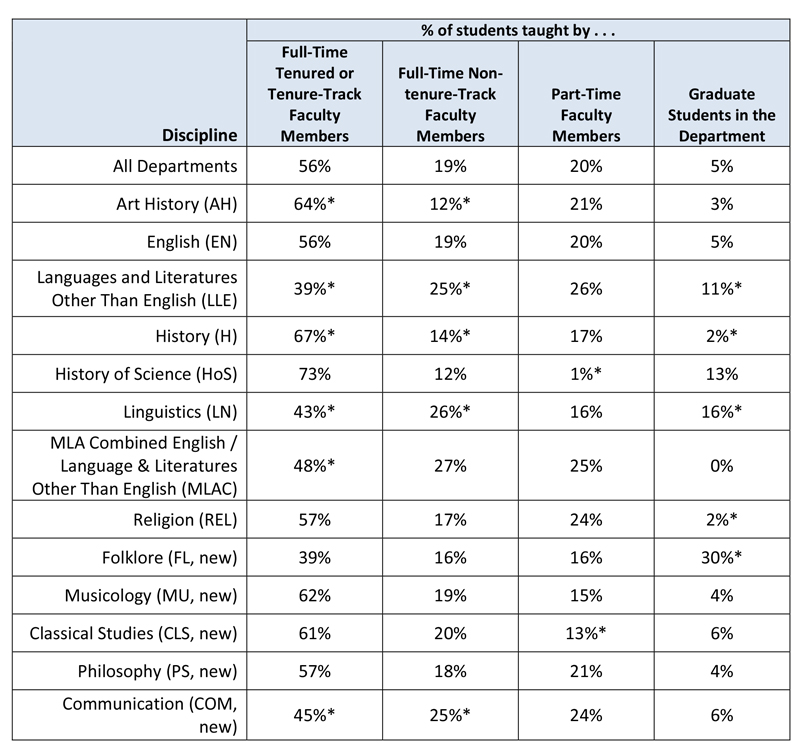
* Proportion is significantly different from all other disciplines combined at the 5% level. We used regression analysis for this test with a binary (0-1) variable for the discipline of interest. If the coefficient for the binary variable differed significantly from 0, then the interpretation from regression is that the discipline differs from all other disciplines combined.
Statistical significance depends on a number of factors, not solely the absolute difference between two values. While differences that are not marked as significant may seem to be the same size as, or even larger than, those marked as significant, they are not statistically significant. The most likely factors contributing to the lack of significance when the absolute difference seems “large enough” are a smaller sample size or a larger variation within that discipline.
Source: Susan White, Raymond Chu, and Roman Czujko, The 2012–13 Survey of Humanities Departments at Four-Year Institutions (College Park, MD: Statistical Research Center, American Institute of Physics, 2014). Study conducted for the American Academy of Arts Sciences’ Humanities Indicators Project.
Instructor of Record for All Other (Nonintroductory) Undergraduate Courses, Fall 2012 Term
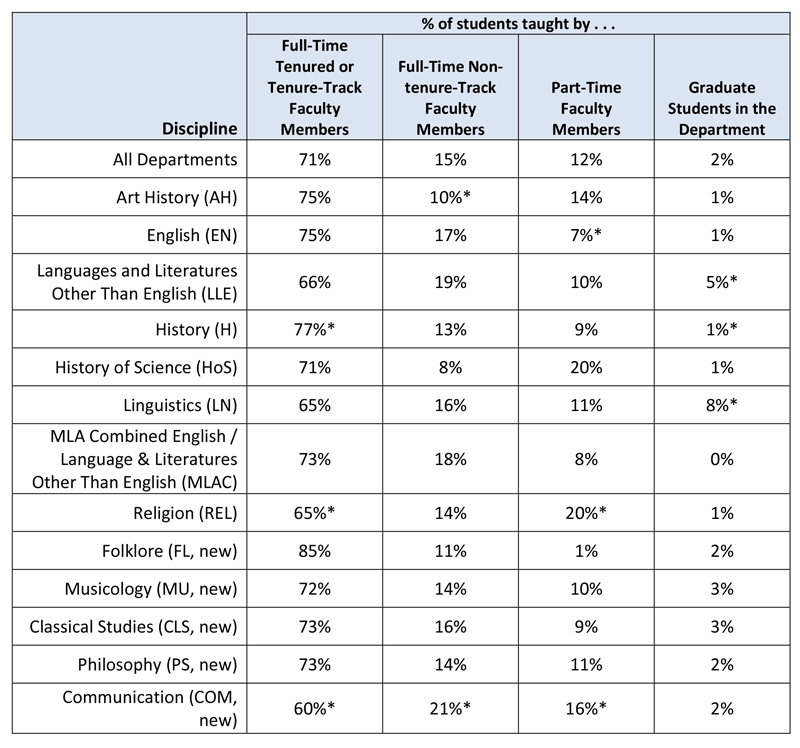
* Proportion is significantly different from all other disciplines combined at the 5% level. We used regression analysis for this test with a binary (0-1) variable for the discipline of interest. If the coefficient for the binary variable differed significantly from 0, then the interpretation from regression is that the discipline differs from all other disciplines combined.
Statistical significance depends on a number of factors, not solely the absolute difference between two values. While differences that are not marked as significant may seem to be the same size as, or even larger than, those marked as significant, they are not statistically significant. The most likely factors contributing to the lack of significance when the absolute difference seems “large enough” are a smaller sample size or a larger variation within that discipline.
Source: Susan White, Raymond Chu, and Roman Czujko, The 2012–13 Survey of Humanities Departments at Four-Year Institutions (College Park, MD: Statistical Research Center, American Institute of Physics, 2014). Study conducted for the American Academy of Arts Sciences’ Humanities Indicators Project.
Statistical significance depends on a number of factors, not solely the absolute difference between two values. While differences that are not marked as significant may seem to be the same size as, or even larger than, those marked as significant, they are not statistically significant. The most likely factors contributing to the lack of significance when the absolute difference seems “large enough” are a smaller sample size or a larger variation within that discipline.
Source: Susan White, Raymond Chu, and Roman Czujko, The 2012–13 Survey of Humanities Departments at Four-Year Institutions (College Park, MD: Statistical Research Center, American Institute of Physics, 2014). Study conducted for the American Academy of Arts Sciences’ Humanities Indicators Project.
Instructor of Record for Graduate Courses, Fall 2012 Term
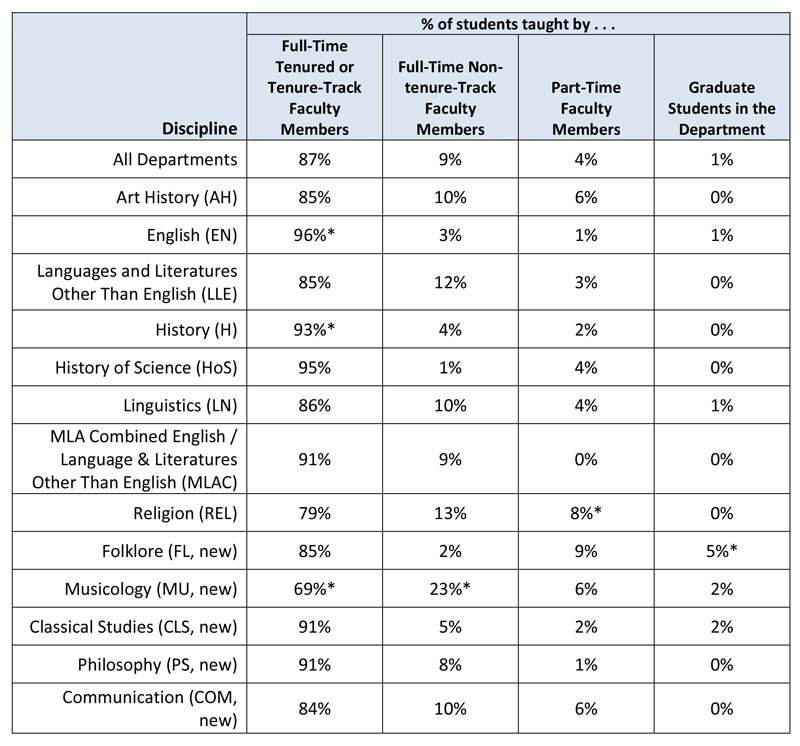
* Proportion is significantly different from all other disciplines combined at the 5% level. We used regression analysis for this test with a binary (0-1) variable for the discipline of interest. If the coefficient for the binary variable differed significantly from 0, then the interpretation from regression is that the discipline differs from all other disciplines combined.
Statistical significance depends on a number of factors, not solely the absolute difference between two values. While differences that are not marked as significant may seem to be the same size as, or even larger than, those marked as significant, they are not statistically significant. The most likely factors contributing to the lack of significance when the absolute difference seems “large enough” are a smaller sample size or a larger variation within that discipline.
Source: Susan White, Raymond Chu, and Roman Czujko, The 2012–13 Survey of Humanities Departments at Four-Year Institutions (College Park, MD: Statistical Research Center, American Institute of Physics, 2014). Study conducted for the American Academy of Arts Sciences’ Humanities Indicators Project.
Statistical significance depends on a number of factors, not solely the absolute difference between two values. While differences that are not marked as significant may seem to be the same size as, or even larger than, those marked as significant, they are not statistically significant. The most likely factors contributing to the lack of significance when the absolute difference seems “large enough” are a smaller sample size or a larger variation within that discipline.
Source: Susan White, Raymond Chu, and Roman Czujko, The 2012–13 Survey of Humanities Departments at Four-Year Institutions (College Park, MD: Statistical Research Center, American Institute of Physics, 2014). Study conducted for the American Academy of Arts Sciences’ Humanities Indicators Project.
Distribution of Humanities Faculty Members Across Tenure Statuses, by Discipline, Fall 2012
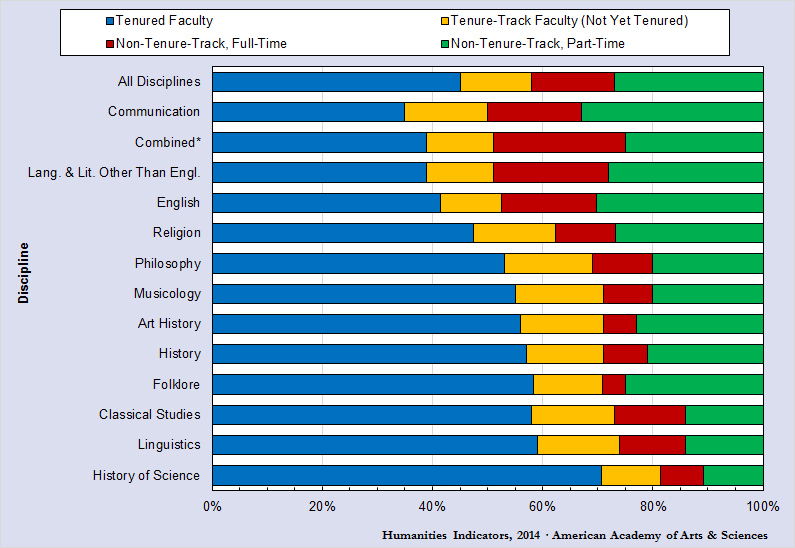
* A combined department is one that grants degrees in English and also in languages and literatures other than English.
Source: Susan White, Raymond Chu, and Roman Czujko, The 2012–13 Survey of Humanities Departments at Four-Year Institutions, Table 2, p. 6 (College Park, MD: Statistical Research Center, American Institute of Physics, 2014). Study conducted for the American Academy of Arts Sciences’ Humanities Indicators Project.
Source: Susan White, Raymond Chu, and Roman Czujko, The 2012–13 Survey of Humanities Departments at Four-Year Institutions, Table 2, p. 6 (College Park, MD: Statistical Research Center, American Institute of Physics, 2014). Study conducted for the American Academy of Arts Sciences’ Humanities Indicators Project.
Percentage of Humanities Faculty Members Employed Part-Time or Off the Tenure Track,* by Discipline, Fall 2012

* "Off the tenure track" includes full- and part-time faculty members. Neither "part-time" nor "off the tenure track" includes graduate instructors.
** A combined department is one that grants degrees in English and also in languages and literatures other than English.
Source: Susan White, Raymond Chu, and Roman Czujko, The 2012–13 Survey of Humanities Departments at Four-Year Institutions, Tables 2–3, pp. 6–7 (College Park, MD: Statistical Research Center, American Institute of Physics, 2014). Study conducted for the American Academy of Arts Sciences’ Humanities Indicators Project.
Percentage of Students Taught by Non-Tenure-Track or Part-Time Humanities Faculty Members, by Course Level and Discipline, Fall 2012*
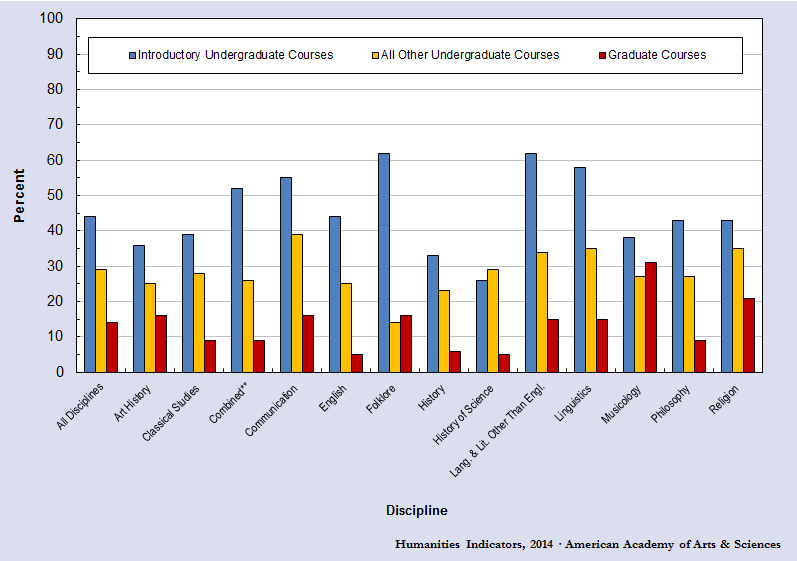
* Includes students taught by graduate instructors.
** A combined department is one that grants degrees in English and also in languages and literatures other than English.
Source: Susan White, Raymond Chu, and Roman Czujko, The 2012–13 Survey of Humanities Departments at Four-Year Institutions, Tables 10–11, 16, pp. 18–19, 25 (College Park, MD: Statistical Research Center, American Institute of Physics, 2014). Study conducted for the American Academy of Arts Sciences’ Humanities Indicators Project.
Percentage of Humanities Faculty Members Who Are Women, by Discipline, Fall 2012
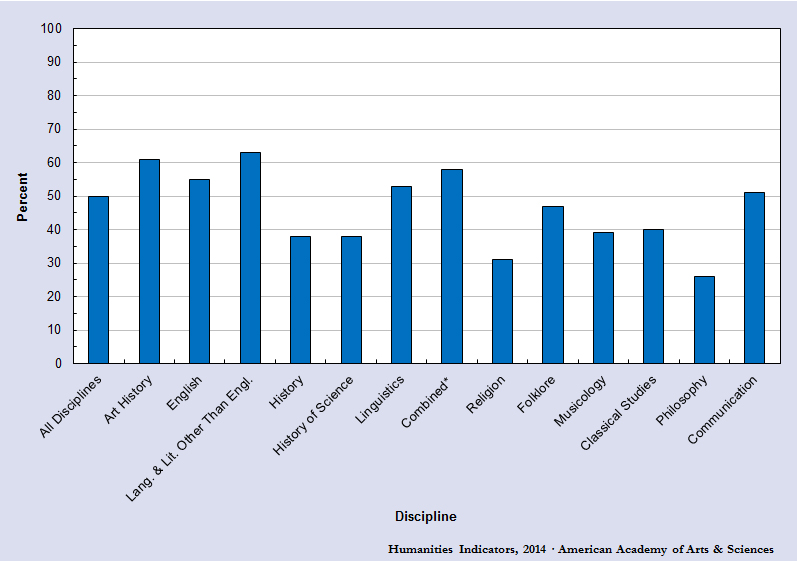
* A combined department is one that grants degrees in English and also in languages and literatures other than English.
Source: Susan White, Raymond Chu, and Roman Czujko, The 2012–13 Survey of Humanities Departments at Four-Year Institutions, Table 3, p. 8 (College Park, MD: Statistical Research Center, American Institute of Physics, 2014). Study conducted for the American Academy of Arts Sciences’ Humanities Indicators Project.
Source: Susan White, Raymond Chu, and Roman Czujko, The 2012–13 Survey of Humanities Departments at Four-Year Institutions, Table 3, p. 8 (College Park, MD: Statistical Research Center, American Institute of Physics, 2014). Study conducted for the American Academy of Arts Sciences’ Humanities Indicators Project.
Percentage of Humanities Faculty Members at Each Tenure Status Who Are Women, by Discipline, Fall 2012
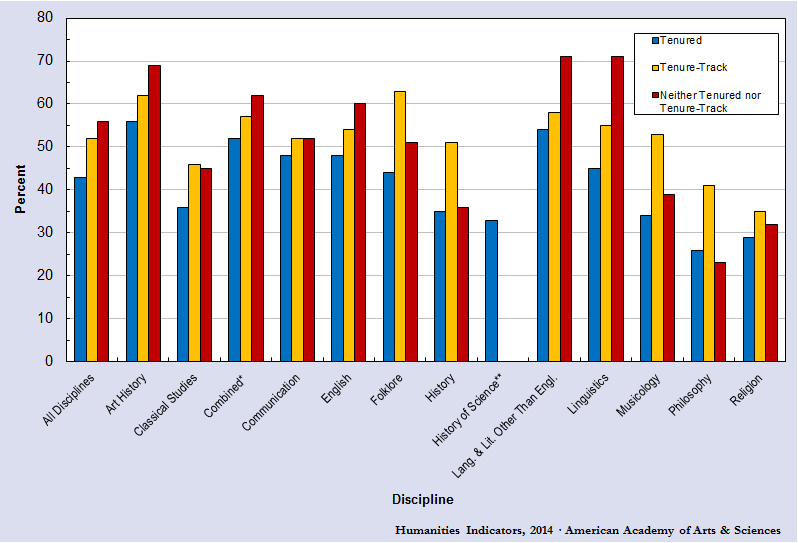
* A combined department is one that grants degrees in English and also in languages and literatures other than English.
** Estimates for the last two faculty categories were excluded because they were of insufficient precision (the standard error associated with each estimate was more than 25% of the estimate's value).
Source: Susan White, Raymond Chu, and Roman Czujko, The 2012–13 Survey of Humanities Departments at Four-Year Institutions, Table 4, p. 10 (College Park, MD: Statistical Research Center, American Institute of Physics, 2014). Study conducted for the American Academy of Arts Sciences’ Humanities Indicators Project.
Humanities Faculty Members Hired for 2012–13 Academic Year Compared to Faculty Who Left Department in Academic Years 2010–11 and 2011–12 (Annual Average), by Discipline
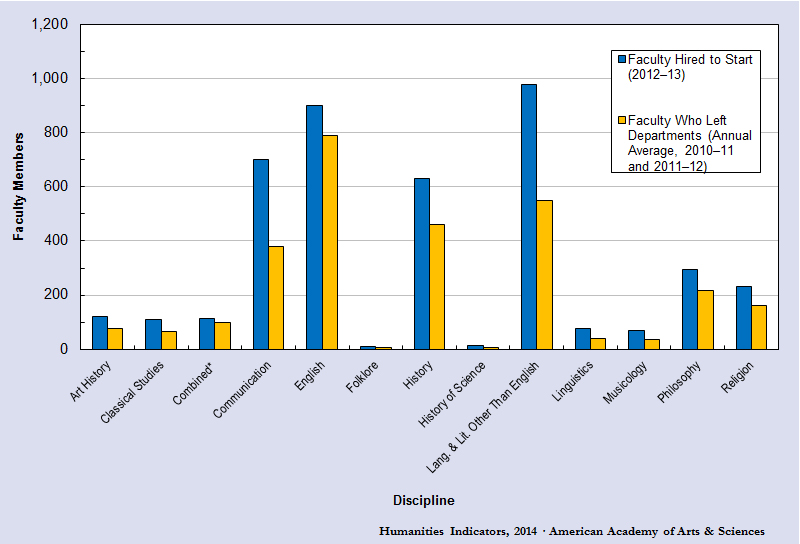
* A combined department is one that grants degrees in English and also in languages and literatures other than English.
Source: Susan White, Raymond Chu, and Roman Czujko, The 2012–13 Survey of Humanities Departments at Four-Year Institutions, Table 5, p. 11 (College Park, MD: Statistical Research Center, American Institute of Physics, 2014). Study conducted for the American Academy of Arts Sciences’ Humanities Indicators Project.
Source: Susan White, Raymond Chu, and Roman Czujko, The 2012–13 Survey of Humanities Departments at Four-Year Institutions, Table 5, p. 11 (College Park, MD: Statistical Research Center, American Institute of Physics, 2014). Study conducted for the American Academy of Arts Sciences’ Humanities Indicators Project.
Information on this site is meant to be used and shared. Feel free to copy, distribute, and transmit text and images from the Humanities Indicators, with attribution.
