Trends in the Demographics of Humanities Students
Findings and Trends
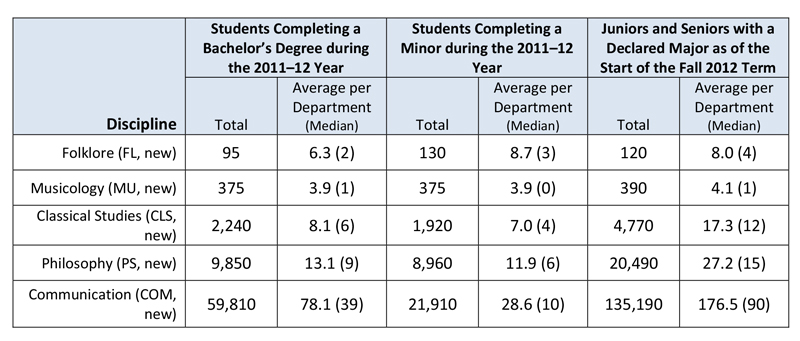
- By a substantial margin, communication programs (a discipline added in the 2012 survey), reported the largest number of declared majors and bachelor’s degrees conferred. Communication departments conferred an estimated average of 78.1 degrees per department in the 2011–12 academic year. The discipline reported an average of 177 majors per department in the fall of 2012 (Figure 1).
- Departments in English language and literature conferred an average of 43 bachelor’s degrees in the 2011–12 academic year, and reported an average of 86.2 majors per department the following fall term, while history conferred an average of 37.8 degrees and reported 93.7 majors per department. By those measures, English and history are the largest of the humanities disciplines covered in the current scope of the humanities used by the Humanities Indicators. Departments of philosophy, the largest of the disciplines included in the current scope of the Indicators to be added in HDS-2, conferred an average of 13.1 degrees and had an average of 27.2 majors in the following fall term.
- Little change was observed from 2007 to 2012 in the numbers of majors declared and bachelor’s degrees conferred by departments included in both HDS-1 and HDS-2. In only two disciplines were statistically significant differences detected. English departments in experienced a decline (of somewhere from 1 to 36 degrees conferred per department) over the five-year period, while linguistics programs reported an increase in both the average number of degrees conferred (up 2.5 to 9.8) and juniors and seniors with declared majors (up 5.3 to 27.1).
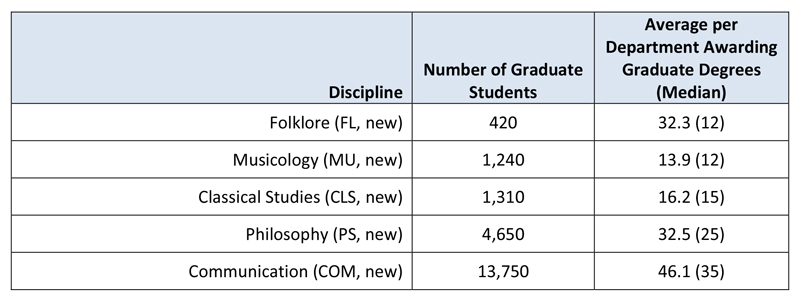
- English departments reported the largest number of students in programs conferring graduate degrees, with an average of approximately 54.3 students per department. While communication had the largest number of undergraduates, the discipline reported slightly fewer graduate students than either English or history (Figure 2).
- Doctoral students in Languages and literatures other than English (LLE) appeared to receive the most departmental support, with approximately 93% of full-time first-year students receiving full financial support for their studies (Figure 3). In comparison, when all disciplines are considered together, 57% of first-year full-time doctoral students received full support, 20% received partial support, and 23% received no support.
Undergraduate Students in HDS-1 Departments: Repeat Disciplines Only
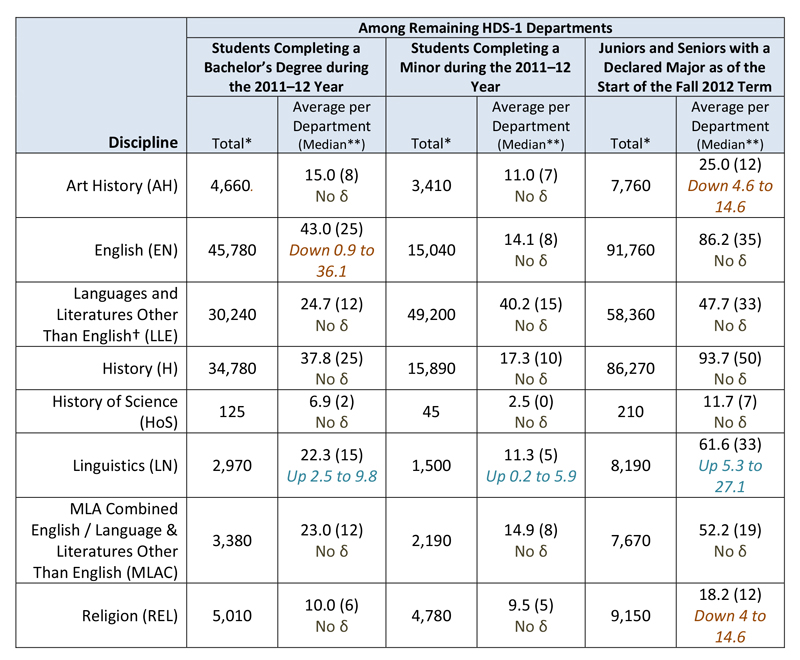
* Totals should not be compared directly with 2007 data since these totals do not include data for any departments that have been created in the interim. These totals can be interpreted as estimates of minima for all 2012–13 departments combined.
** The medians were not compared with medians from the previous study; no estimate of change is included.
† Some of the departments classified as LLE for HDS-1 have been reclassified as Classical Studies for HDS-2. Any comparisons are made using only departments classified as LLE for both HDS-1 and HDS-2.
Source: Susan White, Raymond Chu, and Roman Czujko, The 2012–13 Survey of Humanities Departments at Four-Year Institutions (College Park, MD: Statistical Research Center, American Institute of Physics, 2014). Study conducted for the American Academy of Arts Sciences’ Humanities Indicators Project.
The 95% confidence interval for the change in average per department from 2007 data is provided in italics; the width of the interval indicates the uncertainty in the estimate. “No δ” indicates any change exhibited is not statistically significant.
Undergraduate Students: New Disciplines Only
Source: Susan White, Raymond Chu, and Roman Czujko, The 2012–13 Survey of Humanities Departments at Four-Year Institutions (College Park, MD: Statistical Research Center, American Institute of Physics, 2014). Study conducted for the American Academy of Arts Sciences’ Humanities Indicators Project.
Number of Graduate Students* in HDS-1 Departments, Fall 2012: Repeat Disciplines Only
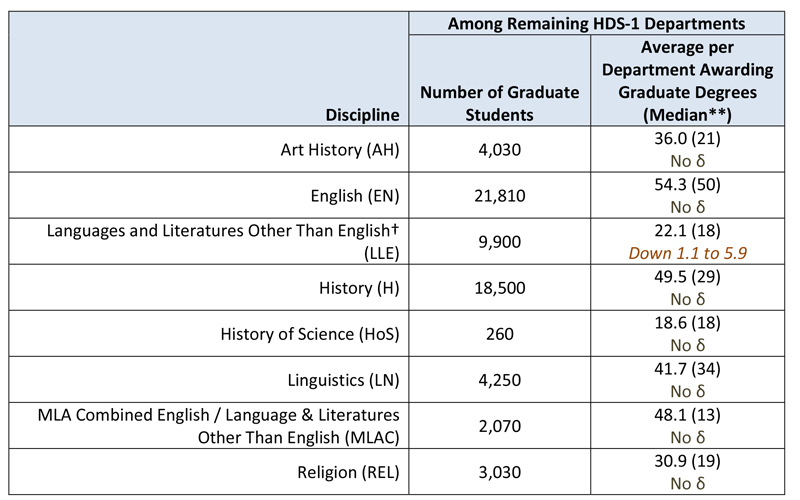
* Totals should not be compared directly with 2007 data since these totals do not include data for any departments that have been created in the interim. These totals can be interpreted as estimates of minima for all 2012–13 departments combined.
** The medians were not compared with medians from the previous study; no estimate of change is included.
† Some of the departments classified as LLE for HDS-1 have been reclassified as Classical Studies for HDS-2. Any comparisons are made using only departments classified as LLE for both HDS-1 and HDS-2.
Source: Susan White, Raymond Chu, and Roman Czujko, The 2012–13 Survey of Humanities Departments at Four-Year Institutions (College Park, MD: Statistical Research Center, American Institute of Physics, 2014). Study conducted for the American Academy of Arts Sciences’ Humanities Indicators Project.
** The medians were not compared with medians from the previous study; no estimate of change is included.
† Some of the departments classified as LLE for HDS-1 have been reclassified as Classical Studies for HDS-2. Any comparisons are made using only departments classified as LLE for both HDS-1 and HDS-2.
Source: Susan White, Raymond Chu, and Roman Czujko, The 2012–13 Survey of Humanities Departments at Four-Year Institutions (College Park, MD: Statistical Research Center, American Institute of Physics, 2014). Study conducted for the American Academy of Arts Sciences’ Humanities Indicators Project.
The 95% confidence interval for the change in average per department from 2007 data is provided in italics; the width of the interval indicates the uncertainty in the estimate. “No δ” indicates any change exhibited is not statistically significant.
Number of Graduate Students, Fall 2012: New Disciplines Only
Source: Susan White, Raymond Chu, and Roman Czujko, The 2012–13 Survey of Humanities Departments at Four-Year Institutions (College Park, MD: Statistical Research Center, American Institute of Physics, 2014). Study conducted for the American Academy of Arts Sciences’ Humanities Indicators Project.
Financial Support for Full-Time First-Year Students in Humanities Doctoral Programs, Fall 2012
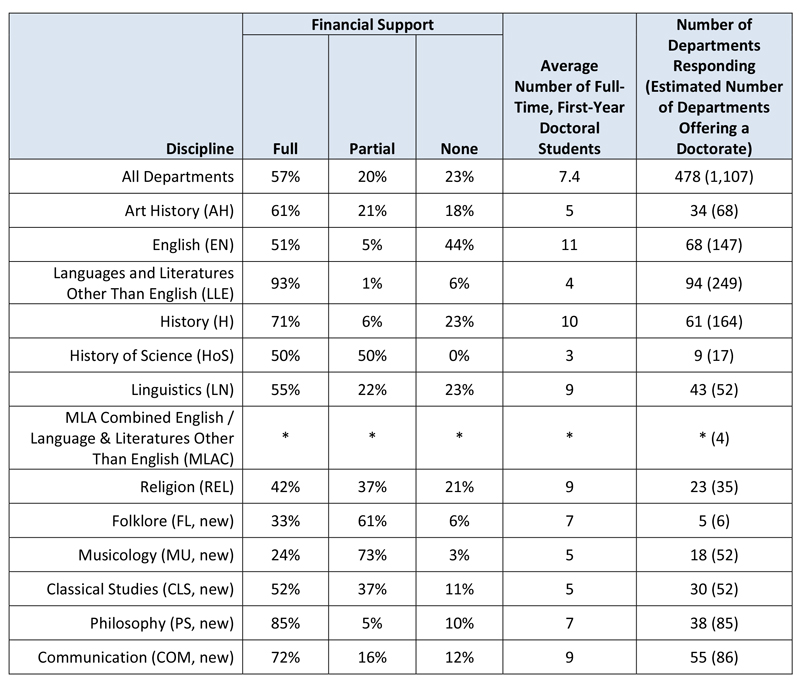
* Only two responding departments offer a doctorate in this area; neither responded to this question.
Source: Susan White, Raymond Chu, and Roman Czujko, The 2012–13 Survey of Humanities Departments at Four-Year Institutions (College Park, MD: Statistical Research Center, American Institute of Physics, 2014). Study conducted for the American Academy of Arts Sciences’ Humanities Indicators Project.
Source: Susan White, Raymond Chu, and Roman Czujko, The 2012–13 Survey of Humanities Departments at Four-Year Institutions (College Park, MD: Statistical Research Center, American Institute of Physics, 2014). Study conducted for the American Academy of Arts Sciences’ Humanities Indicators Project.
Average Number of Bachelor’s Degrees Conferred (Academic Year 2011–12) and Juniors and Seniors with Declared Majors in Discipline per Humanities Department (Fall 2012), by Discipline
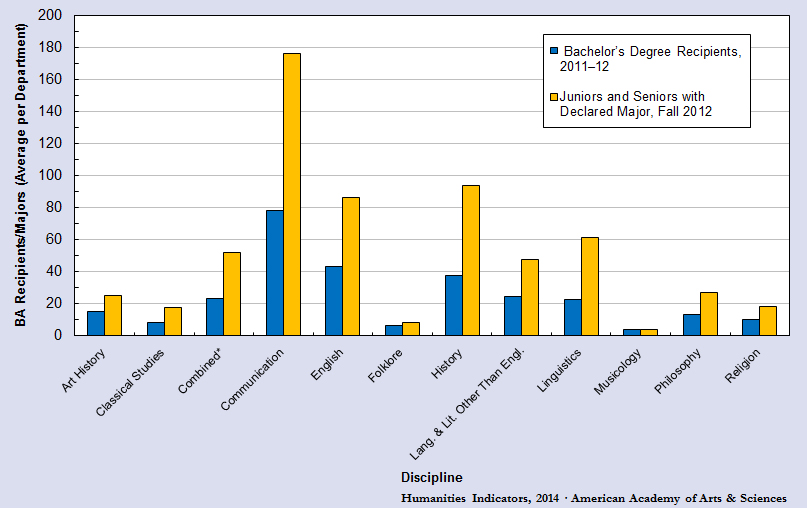
* A combined department is one that grants degrees in English and also in languages and literatures other than English.
Source: Susan White, Raymond Chu, and Roman Czujko, The 2012–13 Survey of Humanities Departments at Four-Year Institutions, Tables 9a and b, pp. 16–17 (College Park, MD: Statistical Research Center, American Institute of Physics, 2014). Study conducted for the American Academy of Arts Sciences’ Humanities Indicators Project.
Source: Susan White, Raymond Chu, and Roman Czujko, The 2012–13 Survey of Humanities Departments at Four-Year Institutions, Tables 9a and b, pp. 16–17 (College Park, MD: Statistical Research Center, American Institute of Physics, 2014). Study conducted for the American Academy of Arts Sciences’ Humanities Indicators Project.
Average Number of Graduate Students per Humanities Department, by Discipline, Fall 2012
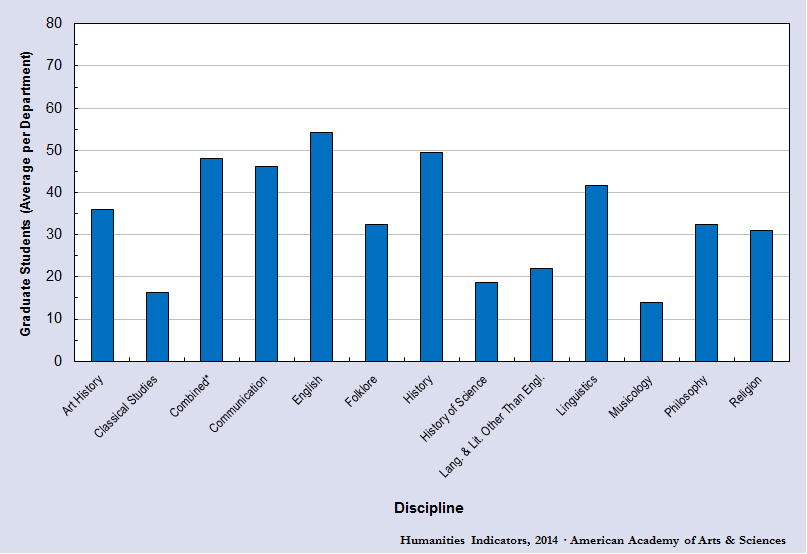
* A combined department is one that grants degrees in English and also in languages and literatures other than English.
Source: Susan White, Raymond Chu, and Roman Czujko, The 2012–13 Survey of Humanities Departments at Four-Year Institutions, Tables 14a and b, pp. 22–23 (College Park, MD: Statistical Research Center, American Institute of Physics, 2014). Study conducted for the American Academy of Arts Sciences’ Humanities Indicators Project.
Source: Susan White, Raymond Chu, and Roman Czujko, The 2012–13 Survey of Humanities Departments at Four-Year Institutions, Tables 14a and b, pp. 22–23 (College Park, MD: Statistical Research Center, American Institute of Physics, 2014). Study conducted for the American Academy of Arts Sciences’ Humanities Indicators Project.
Percentage of Full-Time First-Year Students in Humanities Doctoral Programs Who Recieve Financial Support, by Extent of Support and Discipline, Fall 2012*
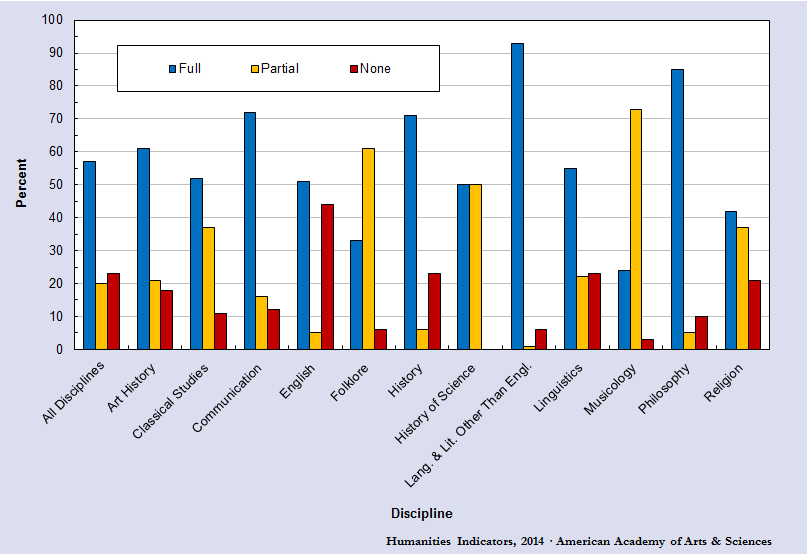
*Only two of the responding combined departments offer a doctorate; neither responded to this question. A combined department is one that grants degrees in English and also in languages and literatures other than English.
Source: Susan White, Raymond Chu, and Roman Czujko, The 2012–13 Survey of Humanities Departments at Four-Year Institutions, Table 15, p. 24 (College Park, MD: Statistical Research Center, American Institute of Physics, 2014). Study conducted for the American Academy of Arts Sciences’ Humanities Indicators Project.
Source: Susan White, Raymond Chu, and Roman Czujko, The 2012–13 Survey of Humanities Departments at Four-Year Institutions, Table 15, p. 24 (College Park, MD: Statistical Research Center, American Institute of Physics, 2014). Study conducted for the American Academy of Arts Sciences’ Humanities Indicators Project.
Information on this site is meant to be used and shared. Feel free to copy, distribute, and transmit text and images from the Humanities Indicators, with attribution.
