Language Instruction in Elementary and Secondary Schools
- The share of high school students graduating in 2019 with LOTE credits was 89%, up from 72% in 1990 (Indicator I-11a). Over 70% of graduates had earned credits in Spanish—a 23 percentage-point increase from 1990. Twelve percent had earned credits in French, down from 21% in 1990. The small percentage of 2019 graduates that had studied German or Latin represented a decrease from 1990.
- While a growing share of students are taking the AP Chinese exam, only 2% of 2019 high school graduates had taken any credits in the language. One percent of 2019 graduates had earned credits in Italian, and another 1% had taken Japanese for credit (for both languages, the same size share as at the turn of the century; these languages are not included in the graph).
- While most students who graduated high school in 2019 had earned at least some LOTE credits, only a fifth of students had taken advanced courses (Indicator I-11b). The taking of such courses, however, was somewhat more common among 2019 graduates than it was among students who graduated in 2000.
- In academic year 2014–2015, the share of LOTE-enrolled elementary and secondary students in individual states ranged from 8.5% in New Mexico to 51.2% in New Jersey (Indicator I-11c). The share for the nation as a whole was 19.7%.
- In that same academic year, almost 70% of K–12 LOTE enrollments were in Spanish (Indicator I-11d). The next largest share was in French (12%). All other languages were substantially less likely to have been studied.
- In academic year 2007–2008, 25% of elementary schools taught LOTE, a decline of six percentage points from 1996–1997 (Indicator-11e).
- Over the two decades for which data are available, private elementary schools were substantially more likely than public schools to expose their students to LOTE, and the disparity increased over time. In 2007–2008, 51% of private elementary schools offered LOTE, a share 36 percentage points higher than for public schools, while 20 years earlier the gap was 17 points.
- American secondary schools were more likely than elementary schools to offer LOTE instruction (Indicator I-11f). In 2007–2008, 79% of secondary schools had LOTE classes. Middle schools, however, were not as likely as high schools to provide students LOTE learning opportunities, and the difference in shares for 2007–2008 (33 percentage points) was the largest recorded and a reversal of a trend toward greater parity.
- The share of secondary schools offering courses in LOTE fell from 1996–1997 to 2007–2008. The change was attributable to a statistically significant drop in the proportion of middle schools offering LOTE courses, from 75% to 58%.
- Public and private secondary schools differed little with respect to the share offering LOTE courses (not pictured).
Source: U.S. Department of Education, National Center for Education Statistics (NCES), National Assessment of Educational Progress, High School Transcript Study. These estimates were prepared by Brian Cramer (NCES) and Rob Perkins (Westat) at the request of the Humanities Indicators (HI). The HI thanks them for their generous assistance. Data presented by the American Academy of Arts and Sciences’ Humanities Indicators (www.humanitiesindicators.org).
* Data for this type of course were not collected in 1990.
Source: U.S. Department of Education, National Center for Education Statistics (NCES), National Assessment of Educational Progress, High School Transcript Study. These estimates were prepared by Brian Cramer (NCES) and Rob Perkins (Westat) at the request of the Humanities Indicators (HI). The HI thanks them for their generous assistance. Data presented by the American Academy of Arts and Sciences’ Humanities Indicators (www.humanitiesindicators.org).
I-11c: Share of K–12 Students Enrolled in LOTE* Courses, by State, Academic Year 2014–2015
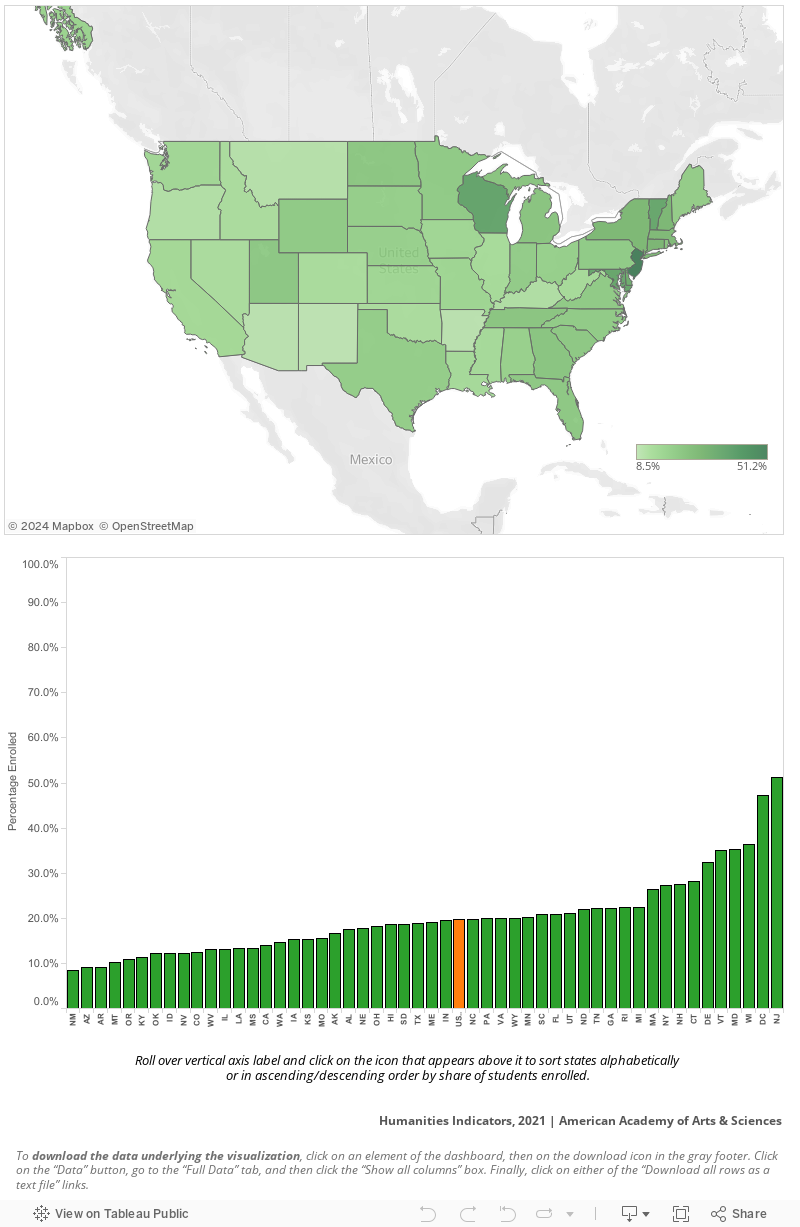
* “LOTE” stands for languages other than English.
Source: American Councils for International Education, American Council on the Teaching of Foreign Languages, Center for Applied Linguistics, and Modern Language Association, The National K–16 Foreign Language Enrollment Report 2014–15 (Washington, DC: American Councils for International Education, 2016), https://www.americancouncils.org/sites/default/files/FLE-report.pdf. Data presented by the American Academy of Arts and Sciences’ Humanities Indicators (www.humanitiesindicators.org).
* Change from academic year 1996–1997 is statistically significant at the 5% level.
Source: Center for Applied Linguistics (CAL), Foreign Language Teaching in U.S. Schools: Results of a National Survey (Washington, DC: CAL, 2010), 22 fig. 1. Data presented by the American Academy of Arts and Sciences’ Humanities Indicators (www.humanitiesindicators.org).
* Change from academic year 1996–1997 is statistically significant at the 5% level.
Source: Center for Applied Linguistics (CAL), Foreign Language Teaching in U.S. Schools: Results of a National Survey (Washington, DC: CAL, 2010), 23 fig. 2. Data presented by the American Academy of Arts and Sciences’ Humanities Indicators (www.humanitiesindicators.org).
