In a series of recent reports, leaders in the sciences, humanities, and higher education have called for additional data on the career outcomes of recipients of graduate degrees.1 Drawing on national surveys of college graduates, the American Academy’s Humanities Indicators offers a fresh perspective on the outcomes of recipients of advanced degrees, providing a snapshot of their earnings, occupations, and job satisfaction.
The Trends for Ph.D.s
Employment trends among doctoral students are a subject of particular concern, as recent data show a substantial shift in the job market after the recession. In new findings about the employment commitments of Ph.D.s at the time they earn their degrees, the Indicators report a sharp decline in the share with jobs or commitments for postdoctoral study. Among new Ph.D. recipients in 2016 (the most recent year with data), almost 62 percent of doctoral degree recipients had a commitment for employment or postdoctoral study after earning their degree, which marked a substantial decline in just ten years and the lowest point on record.
Doctoral degree recipients in the humanities appeared to be the hardest hit, as barely half of new humanities Ph.D. recipients reported a firm commitment for employment or postdoctoral study. The humanities have traditionally lagged behind other fields on this measure, but the share reporting a job or postdoctoral study commitment after graduation fell 22 percent from 2006 to 2016. While the humanities experienced the largest decline, every field except for the behavioral and social sciences saw their shares of doctoral students with a definite job commitment fall by more than 15 percent.
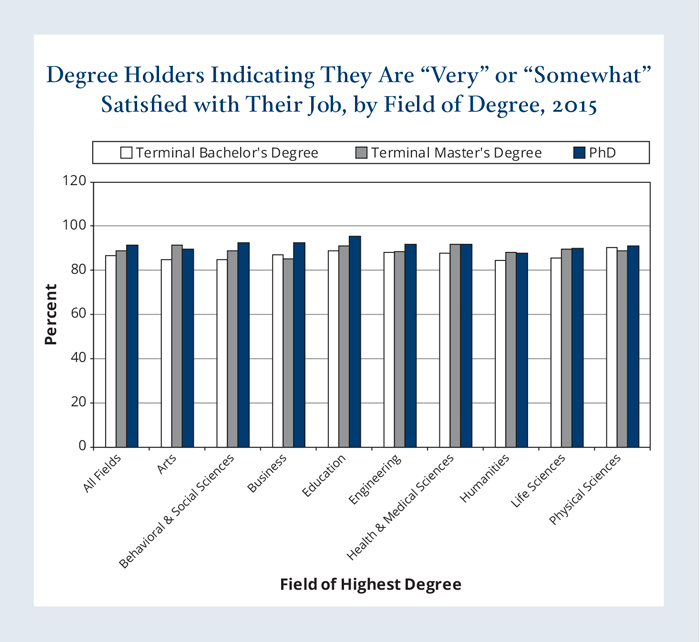 |
| Figure 1. Source: National Science Foundation, 2015 National Survey of College Graduates. Data analyzed and presented by the American Academy’s Humanities Indicators. |
These trends, combined with growing difficulties in the academic job market, have raised renewed questions about the purpose of doctoral study and the preparation of students for future careers. The leading scholarly societies in the humanities have focused considerable effort over the past five years on promoting “career diversity” in doctoral training, and a new report by the National Academies calls on the STEM fields to focus on training their students for diverse “professional contexts.”2
A separate set of Indicators, highlighting the wide occupational differences among recipients of doctoral degrees, suggests why the humanities arrived at the career diversity issue before the STEM fields. Ph.D. recipients in the humanities appear much more likely to take employment in postsecondary teaching in comparison to other fields. As of 2015, 56 percent of employed humanities Ph.D.s were teaching at the postsecondary level as their principal occupation, as compared to 29 percent of employed doctoral degree recipients in all fields combined.
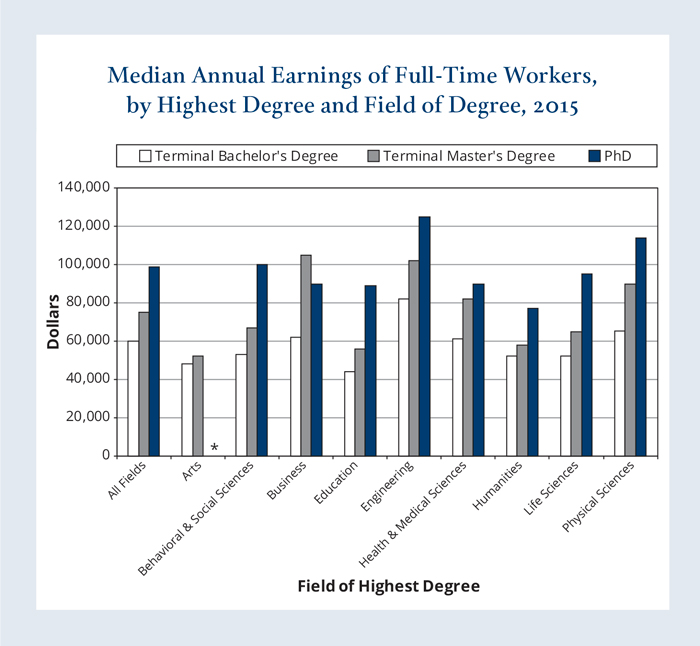 |
| Figure 2. Source: National Science Foundation, 2015 National Survey of College Graduates. Data analyzed and presented by the American Academy’s Humanities Indicators. *Sample size for doctoral degree recipients in the arts was too small for an accurate estimate of earnings. |
Even in the 2016 cohort of Ph.D.s with job commitments, the humanities graduates appeared much more likely to look to colleges and universities for employment. Despite the recent decline in employment commitments at graduation, and a sharp drop in jobs advertised with scholarly societies in the field, 76 percent of humanities doctoral degree recipients with an employment commitment in the United States indicated they would be taking a job in the academic sector (including full- and part-time faculty and administrative appointments). Among doctoral degree recipients from all fields, the share was less than 45 percent.3
Despite the challenges for recent Ph.D.s on the job market, overall, doctoral degree recipients seem satisfied with their jobs. The Indicators report that 91 percent of Ph.D. recipients were “very” or “somewhat” satisfied with their employment in 2015 (Figure 1). Once again, however, doctoral degree recipients in the humanities were the notable exception. The share of humanities Ph.D.s employed outside academia who reported they were satisfied with their jobs was more than 11 percentage points below that of humanities Ph.D.s in academia (80 percent as compared to 91 percent). In contrast to the humanities Ph.D.s, doctoral degree recipients from all fields with employment outside of academia reported a high level of job satisfaction (92 percent), again underscoring the unusual focus of humanities Ph.D.s on college and university employment.
The disproportionate share of humanities Ph.D.s employed in academia also has another effect, as the relatively low salaries for college and university faculty–particularly for faculty in the humanities–lead to below-average earnings relative to other fields. The Indicators reports median earnings of $99,000 for doctoral degree recipients in all fields (see Figure 2). The median earnings range from a low of $77,000 for humanities Ph.D.s to a high of $125,000 for doctorate recipients in engineering.
Careers with Master’s Degrees
While the career outcomes of Ph.D.s tend to receive the most attention, due to their role in academia and the extended time it takes to earn the degree, a substantially larger number of students earn master’s degrees each year. The Indicators also provides new information on the career outcomes of those whose highest degree is a terminal master’s degree. While there is no comparable data about the recent trends in their job outcomes as they earn their degrees, new reports from the Indicators find that they also have high levels of job satisfaction, have higher median earnings than those who lack a graduate degree, and are more likely to be in higher-level jobs.
Almost 90 percent of employed graduates with a terminal master’s degree were in a management or professional position in 2015, as compared to 62 percent of graduates with just a bachelor’s degree. And that difference shows up in their median earnings, as terminal master’s degree recipients had median earnings of $77,000, as compared to $60,000 for those working with only a bachelor’s degree. Among recipients of terminal master’s degrees, graduates from the arts and education had the lowest median earnings (at $52,000 and $56,000, respectively), while graduates from business and engineering programs had the highest median earnings ($105,000 and $102,000, respectively).
Overall, 89 percent of the recipients of terminal master’s degrees reported they were “very” or “somewhat” satisfied with their employment in 2015, and graduates working with a terminal master’s degree reported high levels of satisfaction with most aspects of their jobs. Across all fields, terminal master’s degree holders expressed the least satisfaction with their opportunities for advancement (less than 66 percent reported satisfaction on this measure) and their salaries (77 percent). On other, less tangible measures, however, such as their contribution to society and the intellectual challenge of their work, the shares reporting satisfaction were generally 84 percent or higher.
There were interesting variations between graduates from particular fields on these measures. For instance, recipients of terminal master’s degrees in education had the highest levels of satisfaction on most aspects of their jobs (especially in their perceived contribution to society, at nearly 94 percent), but reported the lowest shares of satisfaction with their salaries (71.5 percent). Graduates from the health and medical sciences had similarly high levels of satisfaction with their contribution to society, but also had one of the highest shares of satisfaction with their salaries (82 percent). Master’s degree recipients from engineering and business, on the other hand, reported relatively low levels of satisfaction with their contribution to society (at below 83 percent) while also having the highest shares of satisfaction with their salaries (above 80 percent).
All these studies represent snapshots of degree recipients at particular moments. In future studies, the Indicators hopes to provide better tracking of degree recipients over time, in order to measure how recipients of advanced degrees fare from the start of a profession with one of these degrees to the end of their careers.
ENDNOTES
1. See, for instance, National Academies of Sciences, Engineering, and Medicine, 2018. Graduate STEM Education for the 21st Century (Washington, D.C.: The National Academies Press, 2018); Rita Karam et al., Managing the Expansion of Graduate Education in Texas (Santa Monica, Calif.: RAND Corporation, 2017); and Jeffrey Allum et al., Understanding PhD Career Pathways for Program Improvement (Washington, D.C.: Council of Graduate Schools, 2015).
2. For the humanities, see Anthony T. Grafton and Jim Grossman, “No More Plan B,” Chronicle of Higher Education, October 9, 2011; and Vimal Patel, “Grants Seek to Foster a Culture Change in Humanities Graduate Education,” Chronicle of Higher Education, August 9, 2016. For the STEM fields, see Graduate STEM Education for the 21st Century.
3. For recent trends in jobs advertised with scholarly societies in the humanities, see “A Path Forward as Academic Job Market in Humanities Falters,” Academy Data Forum (August 28, 2017)