Section 1: Current Revenue Sources for Public Research Universities
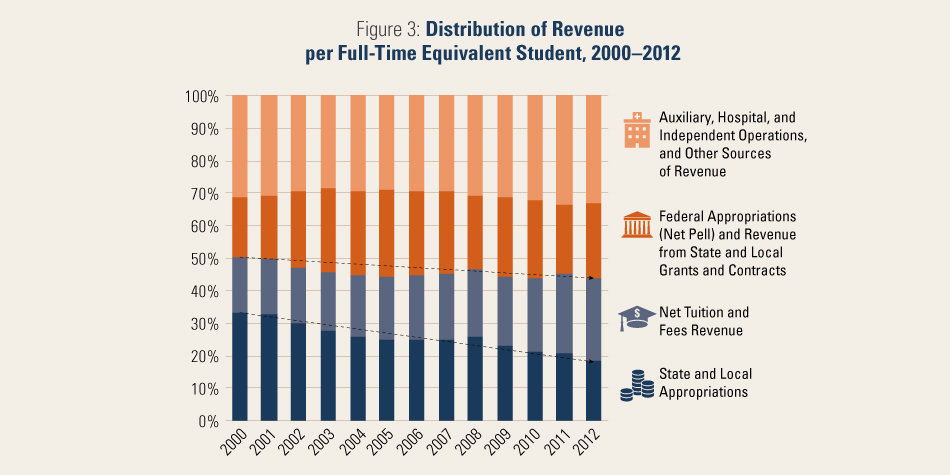
Net tuition is the published tuition minus any grants, loans, or other aid; in other words, it is the actual amount students pay to attend an institution. While auxiliary activities like housing management and food services are important components of universities, they are generally self-funding and do not contribute substantial revenue to the core operating budget of the university. Source: National Center for Education Statistics, IPEDS Analytics: Delta Cost Project Database 2000–2012, https://nces.ed.gov/ipeds/deltacostproject/.
State Support
The turn of the twenty-first century introduced a period of fundamental change to the sources of revenues at public research universities. Traditionally, public research universities received the largest portion of their funding for operations (including education) from state and local appropriations. But between 2000 and 2012, state appropriations to public research universities declined by 34 percent per full-time equivalent (FTE) student; meanwhile, public research universities increased the number of students they educate by approximately 23 percent.3 The causes of these shifts—detailed in the Lincoln Project’s previous publication, Public Research Universities: Changes in State Funding—include increasing enrollment; rising costs of health care, prisons, and K–12 education; increasing numbers of mandated requirements; and the economic recession.
Other Sources of Funding
As state appropriations for higher education diminish, public universities increasingly rely on other sources to advance their mission and maintain the quality of education and training they provide: tuition, philanthropy, auxiliary services, grants and contracts, and endowment and investment income. The extent to which individual public research universities rely on diverse sources of funding varies greatly by location, demographics of students served, state aid programs, and relationships with regional business and industry. Some institutions fare better than others due to generous state funding, robust philanthropic enterprises, or lucrative partnerships with local corporations.
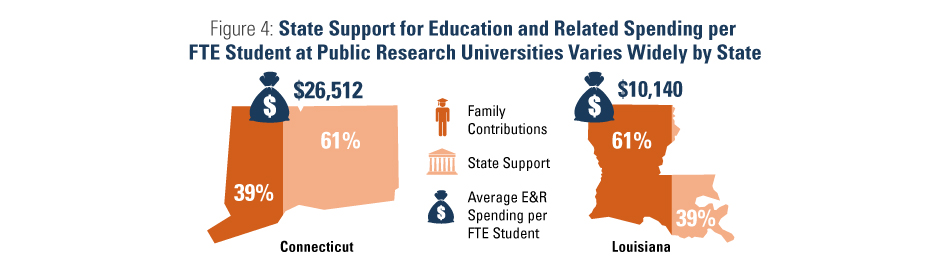 |
Connecticut and Louisiana represent opposite ends of the spectrum, with public research universities distributed across the range of total educational expenses and proportions of state and student contributions. Data from 2012. Source: National Center for Education Statistics, IPEDS Analytics: Delta Cost Project Database 2000–2012, https://nces.ed.gov/ipeds/deltacostproject/.
The Decentralization of University Budget ManagementBudgeting at public research universities has changed dramatically in the last thirty years. In the early 1980s, most universities operated with a central budgeting model, in which the provost (or vice president for academic affairs) and the CFO (or vice president for business and administration) split control of the budget, according to function. Many public research universities introduced Resource/Responsibility Centered Management (RCM) in the late 1980s and early 1990s. The RCM approach moves the responsibility for a balanced budget to the unit or school level: the central administration taxes units to advance the common mission of the university, but schools and units manage their own resources. |
Tuition and Fees
While higher education is the “balance wheel” of state budgets, tuition is the balance wheel of public university budgets: it is one of the only unrestricted sources of funding that the institution receives.4 To compensate for the decline in state subsidies at a time of increasing enrollment, tuition and fees increased to surpass both state and federal appropriations as a source of revenue for public research universities. In fact, recent data reveal that revenues from tuition and fees now average more than one-half (and often far more) of the core education expenditures at public research universities.5
Even with the rise in tuition prices, tuition often only covers one-third to one-half of the total cost of education. While net tuition revenue (total revenue from tuition and fees minus grant and loan aid) has risen at all public research universities, only 17 percent of first-year students in AY2013–2014 paid full tuition without receiving any form of financial aid.6
Philanthropy
At public research universities, philanthropy supports an average of 7.5 percent of core institutional budgets. The proportion is greater at “very high” research universities (8.9 percent) than at “high” research universities (6.2 percent). In 2013, public research universities reported over $5.17 billion in gifts.7 There is wide variation within these averages, including several schools—the University of California, Berkeley; University of Michigan; University of Virginia; and University of Texas at Austin—that have successfully launched and completed $3 billion (or greater) campaigns, accounting for a large portion of this total. Nevertheless, the effects of fundraising, even at smaller institutions with more limited donor prospects, can be significant.8
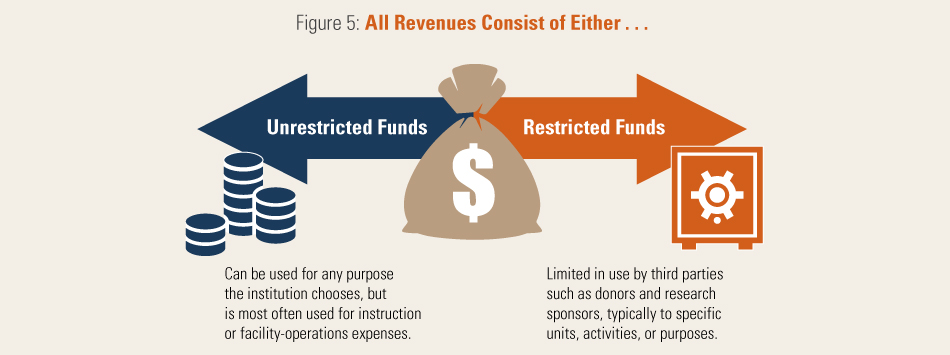
As state appropriations have decreased, restricted funds have grown as a percentage of total budgets at public research universities. While federal appropriations and revenues from state and local grants and contracts have increased since 2000, these are restricted to purposes specified in the original agreements and can rarely, if ever, be shifted to cover educational expenses. The net effect of a shift over time from unrestricted funds to restricted funds is a decline in the budgetary flexibility of public research universities.
Gifts and grants from nonprofit foundations and other private organizations are an important component of fundraising. In 2012, foundations awarded a total of $1.77 billion to higher education, of which $639 million went to public colleges and universities (including community colleges, comprehensive state colleges, and public research universities), with the rest going to private colleges and universities.9 However, gifts and grants from foundations often fund very specific projects and their associated project costs, and do not cover the costs of overhead, which can include administrative expenses and utilities. This often results in institutions having to provide operational support for grants received. In short, foundation support is not a substitute for state appropriations, tuition, or other unrestricted funding.
Private research universities have a long history of successfully fundraising from their alumni, while development is a fairly new operation at most public research universities. Many alumni of public research universities continue to assume that their alma maters are adequately supported by the state. Updating public perceptions of state university financing is a key step in cultivating public university alumni giving.
One major caveat to the use of private gifts is that they are very often restricted to particular purposes outlined by the donor (such as scholarships, buildings, or faculty chairs) and are often supplemental to preexisting gifts.10 As such, private gifts—like foundation gifts and grants—often cannot substitute for state funding. While philanthropic gifts advance the institution, it is a challenge for—and the responsibility of—public research universities to find creative ways to use philanthropy to support core operations.
Auxiliary Services
Public research universities receive some revenue from auxiliary services such as housing, university presses and bookstores, and food service. (Contrary to popular belief, in very few cases do athletics revenues exceed their expenses.)11 Many of these enterprises are self-supporting, with any surplus revenue reinvested in the operation of the service. As a result, use of these funds is generally restricted.
Grants and Contracts
Public research universities also receive funds from the federal, state, and local governments in the form of grants and contracts. The largest examples of these are grants for financial aid and research. As engines of research, public research universities often receive significant support from agencies like the National Science Foundation, National Institutes of Health, and Department of Defense.12 Garnering these funds is very competitive and use of these funds is highly restricted, but research funding often generates resources that help support faculty salaries and student fellowships.
Endowments and Investment Income
Some public research universities receive revenue from investment returns on institutional cash balances and endowment income, but these are usually restricted and often minimal when compared to their private counterparts. Only a handful of public research universities benefit from endowments, such as the University of Michigan, whose annual return now surpasses state appropriations.13 Yet even when the return on investment is quite large, the dollar amount per enrolled student (a popular measure for the impact of an endowment’s return) is very low relative to smaller private universities.14
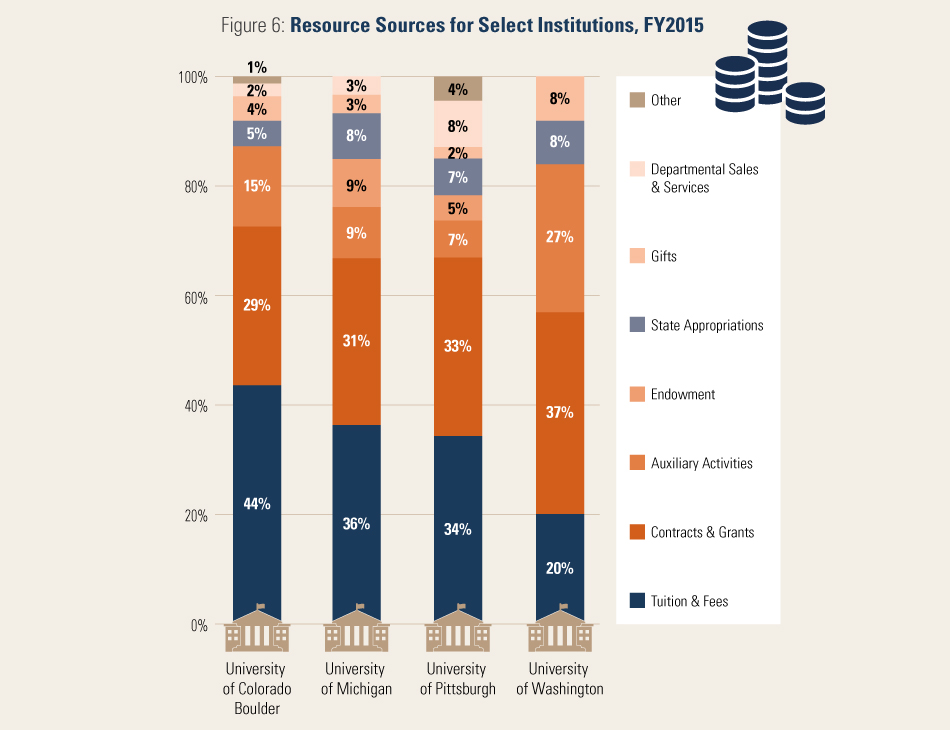
These data exclude revenues from university health systems. For the University of Pittsburgh, “Other” includes rental revenue, patent and royalty revenue, faculty and staff newspaper advertising and subscriptions sales, and symposium registration fees. For the University of Colorado Boulder, “Other” includes facilities-rental and royalty income, and miscellaneous fees, fines, and charges for services (including application fees, library fines, and testing fees). Source: Office of Planning, Budget, and Analysis, University of Colorado Boulder; Office of Budget and Planning, University of Michigan; Office of the Provost, University of Pittsburgh; and Office of Planning and Budgeting, University of Washington.
ENDNOTES
3 National Center for Education Statistics, IPEDS Analytics: Delta Cost Project Database 2000–2012, https://nces.ed.gov/ipeds/deltacostproject/.
4 American Academy of Arts & Sciences, Public Research Universities: Changes in State Funding, (Cambridge, Mass.: American Academy of Arts & Sciences, 2015), 4.
5 Delta Cost Project, Trends in College Spending 1999–2009 (Washington, D.C.: Delta Cost Project, 2011), 31, http://www.deltacostproject.org/sites/default/files/products/Trends2011_Final_090711.pdf.
6 National Center for Education Statistics, 2011–2012 National Postsecondary Student Aid Study (NPSAS:12) (U.S. Department of Education, Institute of Education Sciences).
7 See National Center for Education Statistics, IPEDS [Integrated Postsecondary Education Data System] (U.S. Department of Education, Institute of Education Sciences), https://nces.ed.gov/ipeds/. Ten institutions were not included in the total due to nonreporting.
8 The Chronicle of Philanthropy, Philanthropy 400 Project, “Philanthropy’s Uneven Climb: Success Stories, Red Flags, and a Trove of Data,” October 29, 2015, https://philanthropy.com/specialreport/philanthropys-uneven-climb-s/73.
9 See the Foundation Center at http://foundationcenter.org/. Gifts recorded are $10,000 or higher and from the top one thousand foundations.
10 National Association of College and University Business Officers, NACUBO-Commonfund Study of Endowments, http://www.nacubo.org/Research/NACUBO-Commonfund_Study_of_Endowments.html.
11 National Science Board, Diminishing Funding and Rising Expectations: Trends and Challenges for Public Research Universities (a companion to Science and Engineering Indicators 2012) (Arlington, Va.: National Science Foundation, 2012), 14, http://www.nsf.gov/nsb/sei/companion2/files/nsb1245.pdf.
12 Delta Cost Project, Academic Spending Versus Athletic Spending: Who Wins? (Washington, D.C.: Delta Cost Project, 2013), 10, http://www.deltacostproject.org/sites/default/files/products/DeltaCostAIR_AthleticAcademic_Spending_IssueBrief.pdf).
13 National Association of College and University Business Officers and the Commonfund Institute, U.S. and Canadian Institutions Listed by Fiscal Year (FY) 2014 Endowment Market Value and Change in Endowment Market Value from FY2013 to FY2014 (Washington, D.C.; Wilton, Conn.: National Association of College and University Business Officers and the Commonfund Institute, revised February 2015), http://www.nacubo.org/Documents/EndowmentFiles/2014_Endowment_Market_Values_Revised.pdf.
14 The College Board, “Trends in Higher Education: Endowment Assets per Student, 2012–13,” http://trends.collegeboard.org/college-pricing/figures-tables/endowment-assets-student-2012-13.