Section 2: Changes in Major University Expenses over Time
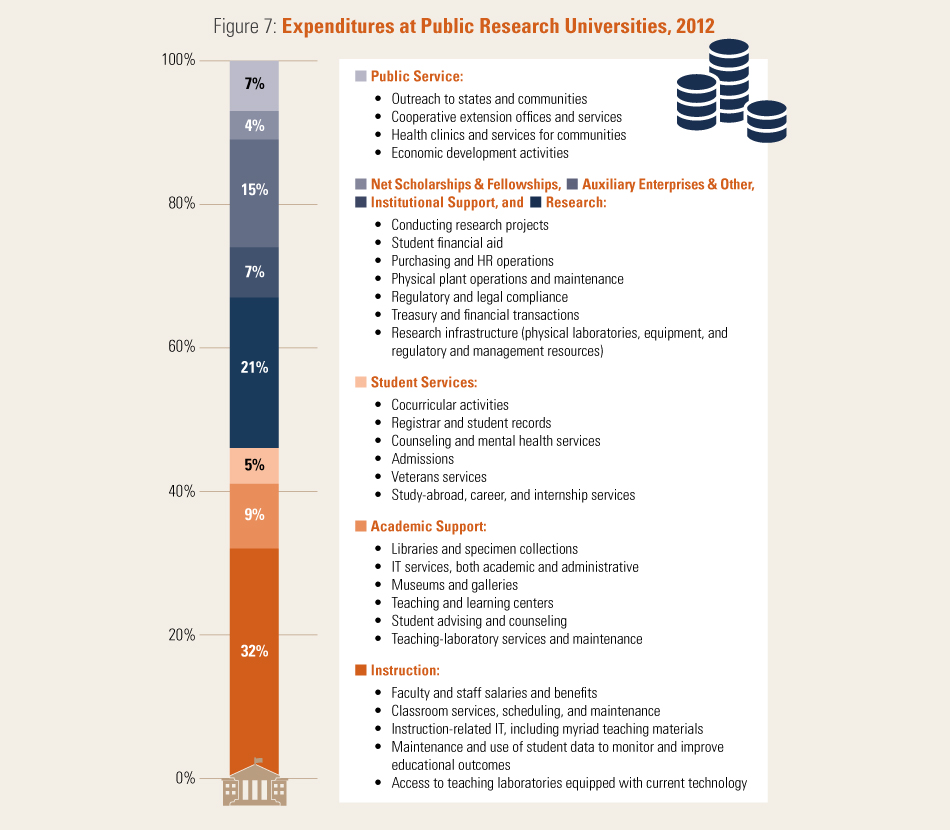
Expenditures related exclusively to education are often referred to as education and related (E&R) expenses, which include spending on instruction (including faculty salaries and benefits), academic support, student services, and a portion of general-support and maintenance costs associated with these functions. E&R expenses also include graduate education and spending on research by the university that is not sponsored by an external entity.15
Between 2000 and 2012, E&R expenses per FTE student on average across all public research universities increased from $15,970 to $17,172—a total of $1,202 per student—representing an increase of less than 1 percent annually.16 (Note that at some Very High Research Activity public universities, such as the University of Michigan and University of California, Berkeley, E&R expenditures per FTE student were closer to $28,000 in AY2012.) Even when considering expenditures broadly, as does Chart 1, budgets have been kept under tight control, particularly in light of the fact that public research universities are serving far more students today than in AY2000.17
Table 1: Spending per
Full-Time Equivalent Student by Standard Expense Category, |
| AY2002 | AY2007 | AY2012 | 10-year Change ($) | % Change from 2002–2012 | |
| Academic Support | $2,685 | $2,854 | $3,212 | $527 | 20 |
| Student Services | $1,318 | $1,388 | $1,525 | $207 | 16 |
| Research | $6,235 | $6,579 | $7,126 | $892 | 14 |
| Net Scholarships & Fellowships | $1,236 | $1,140 | $1,403 | $167 | 13 |
| Institutional Support | $2,361 | $2,567 | $2,630 | $269 | 11 |
| Instruction | $10,377 | $10,647 | $11,011 | $634 | 6 |
| Public Service | $2,269 | $2,301 | $2,346 | $77 | 3 |
| Operations & Maintenance | $2,142 | $2,369 | $1,981 | ($161) | (8) |
Source: National Center for Education Statistics, IPEDS Analytics: Delta Cost Project Database 2000–2012, https://nces.ed.gov/ipeds/deltacostproject/.
The five expense categories that have increased most dramatically over the last decade are 1) academic support; 2) student services; 3) research, with an implied link to graduate education; 4) net scholarships and fellowships; and 5) institutional support. Each of these is reflective of the principal activities hosted by public research universities and of the changing demographics of students being served. Academic support has drawn more resources because today’s students both require and expect ancillary technology and services to enhance their educational experience. Student services have continued to expand as institutions have enrolled increasingly diverse student bodies with greater need for counseling and support, and as safety and security for all members of university communities has become a greater priority.18 Additionally, there are greater demands for accountability from the federal sector than ever before, often in the form of unfunded federal mandates that lead to increased costs (such as the Clery Act, which requires colleges to provide and publicize information about campus crimes). As the nation’s research needs have changed, universities have continued to compete effectively for federal research dollars from government agencies across broad categories. Net scholarships and fellowships have increased to offset rises in tuition. Institutional support has grown modestly and reflects the imperative for universities to keep classrooms and laboratories updated and capable of supporting modern instructional strategies.
Policy regulations and expectations about the role of public research universities have also shifted over time. Since new regulations and legal mandates are almost always unfunded, the growing web of reporting processes demands increasing financial resources. Yet calculating the added cost of regulation is difficult and has only been attempted at a small number of institutions. Most recently, Vanderbilt conducted an extensive analysis of expenses related to federal mandates and found that eleven cents of every tuition dollar is spent on compliance with legal and regulatory mandates.19
Compensation and Staffing
Like all colleges and universities, public research universities devote more than half of their E&R spending to employee compensation.20 Since the core missions of these institutions include research and graduate instruction, staffing levels are relatively high and demands on faculty and staff time are intense. However, it is important to note that faculty salaries have been slow to rise in the last decade. According to the American Association of University Professors, between AY2008 and AY2012, salaries at public research universities grew only 1.12 percent annually, well below the average annual rate of U.S. inflation.21
Popular discussion often inaccurately attributes rising tuition solely to “administrative bloat” at public universities. However, the Delta Cost Project at the American Institutes for Research (AIR) found that in 2012, public research universities employed 30 fewer staff per thousand FTE students compared with 2002. In contrast, during this same time period, private institutions increased staff by 137 employees per thousand FTE students. Clearly, rising tuition at public research universities is not due to unrestrained hiring of staff, administrative or otherwise. In Figure 8, the full array of hiring patterns for faculty and staff between 2002 and 2012 is displayed.
Public research universities that host large hospital and medical center operations are not accounted for in the figure. Source: See National Center for Education Statistics, IPEDS [Integrated Postsecondary Education Data System] (U.S. Department of Education, Institute of Education Sciences), https://nces.ed.gov/ipeds/.
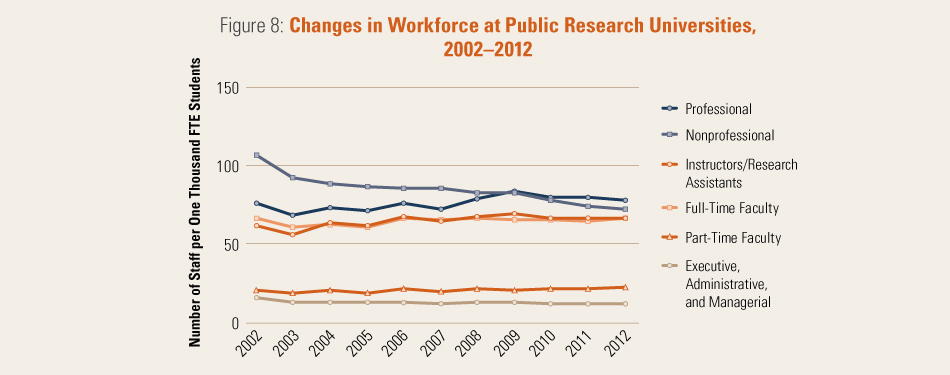
Professional staff includes positions such as business analyst, human resources staff, and admissions staff. Source: National Center for Education Statistics, IPEDS Analytics: Delta Cost Project Database 2000–2012, https://nces.ed.gov/ipeds/deltacostproject/.
However, the costs of benefits for existing employees and retirees are rising and have a large impact on the operations budget of public research universities. Such benefits include medical and dental plans, retirement contributions, Social Security, unemployment and Medicare taxes, life and disability insurance plans, and, in some instances, tuition benefits. Depending on the state and the higher education oversight within that state, universities are often constrained in managing these costs because they are treated as “fixed” costs within the state budget and are not under the control of individual institutions.
Adding to the complexity of the costs of benefits is the variation in pension plans across states and higher education systems. In general, pension plans represent obligations to retired and current employees that must be met by law.
ENDNOTES
15 Delta Cost Project, Trends in College Spending 1999–2009, 20.
16 National Center for Education Statistics, ipeds Analytics: Delta Cost Project Database 2000–2012.
17 National Center for Education Statistics, IPEDS.
18 Robin Wilson, “An Epidemic of Anguish,” The Chronicle of Higher Education, August 31, 2015.
19 Vanderbilt University, The Cost of Federal Regulatory Compliance in Higher Education: A Multi-Institutional Study (Nashville, Tenn.: Vanderbilt University, 2015).
20 Delta Cost Project, Labor Intensive or Labor Expensive? Changing Staff and Compensation Patterns in Higher Education (Washington, D.C.: Delta Cost Project, 2014), 15.
21 John Barnshaw and Samuel Dunietz, Busting the Myths: The Annual Report on the Economic Status of the Profession, 2014–15 (Washington, D.C.: American Association of University Professors, 2015). Inflation data are based on the Consumer Price Index; see The World Bank, “Inflation, Consumer Prices (Annual %),” http://data.worldbank.org/indicator/FP.CPI.TOTL.ZG.