Years to Attainment of a Humanities Doctorate
- For each of the graduation years 2003 to 2020, the median time humanities and arts Ph.D. recipients spent in their doctoral programs was 6.8 years or longer (Indicator II-27a).2 The median fell from 7.5 years for 2003 graduates to 6.9 years for students graduating in 2011 and was in the vicinity of that number for most years through 2020 (when the median was 6.8 years).
- From 2003 to 2020, the humanities and arts had a consistently longer median time-to-degree than doctoral education generally, ranging from one year longer in 2020 (and in several other years) to 1.6 years longer in 2003. The median for all fields considered together was relatively consistent over the time period, ranging from 5.7 to 5.9 years.
- A comparison of the three broad humanities disciplinary groupings used in the SED reveals only modest differences with respect to median time-to-degree over the 2003–2020 time period (Indicator II-27b). The greatest difference, approximately one year, was between “Letters”3 and history in 2007 (6.7 and 7.7 years respectively). Over this same time period, each of the broad disciplinary clusters experienced a decline in time-to-degree of similar magnitude (ranging from 0.7 years in history to a full year in languages and literatures other than English).
- In every year from 2015 to 2020 the difference, if any, between women and men4 in the median number of years to completion of a humanities and arts Ph.D. was small (findings not visualized). Differences in median time-to-degree when graduates are categorized by race and ethnicity were similarly small. Averaging across the 2015–2020 time period, the median time-to-degree ranged from a low of 6.9 years for White students to a high of 7.4 years for American Indian/Alaska Native students.
- Data gathered from 2004 to 2012 (of a type that the SED no longer collects) show that humanities and arts Ph.D.’s took longer to reach the dissertation stage of their program than graduates in other fields (except the social sciences), and this discrepancy accounted for humanities and students’ longer time-to-degree over that time period (Indicator II-27c). The median number of years humanities and social sciences graduates spent taking courses or preparing for exams was four years, as compared to medians of two to three years in the natural science fields. The median time spent working on the dissertation after coursework and exams (non-course-related preparation and research, writing, and defense) was similar among the fields. With the exception of the 2006–2009 period (in which the median for the social sciences was two years), graduates in each of the fields examined here spent a median of three years at the dissertation stage.
* Time in doctoral program is measured as the difference between the month and year the doctorate was granted and the month and year the doctoral program was started; however, program start is based on master’s program entry if the master’s degree was at the doctoral institution in the same fine field of study or was a prerequisite to the doctorate. The values for time to degree for years 2003 to 2012 are derived from custom tabulations purchased by the Humanities Indicators in 2014. Starting in 2014, the Indicators’ method for calculating time-to-degree (as time in doctoral program) was adopted by the data collector, but they did not include a value for 2013 in any of their published reports.
** Life sciences includes agricultural sciences and natural resources; biological and biomedical sciences; and health sciences.
† Physical sciences includes earth, computer, and information sciences, as well as mathematics. The latter three fields were reported separately beginning in 2015.
Source: National Science Foundation, National Center for Science and Engineering Statistics (NCSES), Survey of Earned Doctorates (SED). A custom tabulation of SED data was prepared for the Humanities Indicators by NORC at the University of Chicago for the years 2003–2012. Since 2014, the values have been reported by NCSES in its annual Doctorate Recipients from U.S. Universities, Table 31, https://www.nsf.gov/statistics/doctorates/ (accessed 2/15/2022). Data presented by the American Academy of Arts and Sciences’ Humanities Indicators (www.humanitiesindicators.org).
The data on which this indicator is based are collected as part of the federal Survey of Earned Doctorates, a national census of recently graduated doctorate recipients.
* Time in doctoral program is measured as the difference between the month and year the doctorate was granted and the month and year the doctoral program was started; however, program start is based on master’s program entry if the master’s degree was at the doctoral institution in the same fine field of study or was a prerequisite to the doctorate. The values for time to degree for years 2003 to 2012 are derived from custom tabulations purchased by the Humanities Indicators in 2014. Starting in 2014, the Indicators’ method for calculating time-to-degree (as time in doctoral program) was adopted by the data collector, but they did not include a value for 2013 in any of their published reports.
** “Letters” encompasses American literature (U.S. and Canada); classics; comparative literature; creative writing; English language; English literature (British & Commonwealth); rhetoric and composition; and speech and rhetorical studies.
Source: National Science Foundation, National Center for Science and Engineering Statistics (NCSES), Survey of Earned Doctorates (SED). A custom tabulation of SED data was prepared for the Humanities Indicators by NORC at the University of Chicago for the years 2003–2012. Since 2014, the values have been reported by NCSES in its annual Doctorate Recipients from U.S. Universities, Table 31, https://www.nsf.gov/statistics/doctorates/ (accessed 2/15/2022). Data presented by the American Academy of Arts and Sciences’ Humanities Indicators (www.humanitiesindicators.org).
The data on which this indicator is based are collected as part of the federal Survey of Earned Doctorates, a national census of recently graduated doctorate recipients.
II-27c: Median Number of Years Spent by Ph.D. Recipients in Their Doctoral Programs, by Field and Phase of Program, Graduation Years 2004–2012*
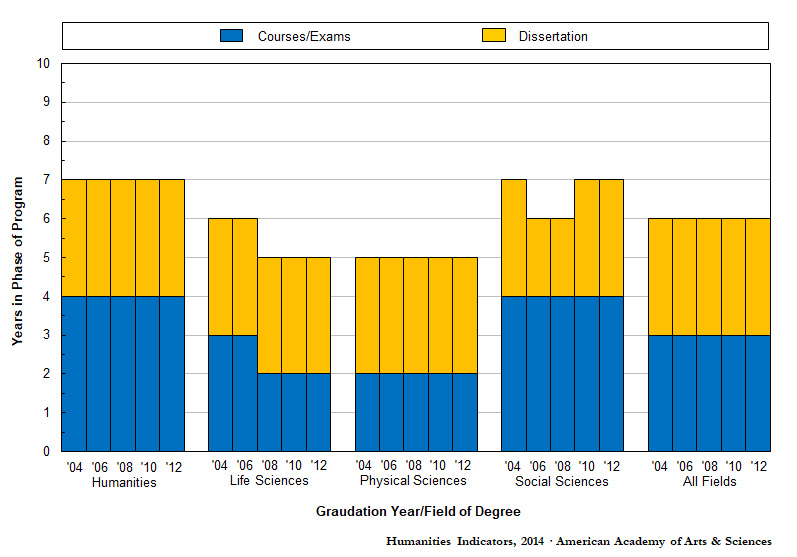
* Estimates include years in master’s degree program if part of the doctoral program. Respondents were directed to report years taking courses or preparing for exams as whole, rounded years.
Source: National Science Foundation, National Center for Science and Engineering Statistics, Survey of Earned Doctorates (SED). A custom tabulation of SED data was prepared for the Humanities Indicators by NORC at the University of Chicago. Data presented by the American Academy of Arts and Sciences’ Humanities Indicators (www.humanitiesindicators.org).
This indicator is based on data yielded by a question asked as part of the annual Survey of Earned Doctorates (see item A12 on the 2012–2013 questionnaire). The question consists of two parts, asking “How many years were you: a. taking courses or preparing for exams for this doctoral degree (including a master’s degree, if that was part of your doctoral program)?” and “b. working on your dissertation after coursework and exams (non-course-related preparation and research, writing and defense)?” The responses were given in whole, rounded years. Life sciences includes agricultural sciences and natural resources; biological, biomedical sciences; and health sciences. Physical sciences includes mathematics and computer and information sciences. Social sciences includes psychology.
