National Endowment for the Humanities (NEH) Funding Levels
- While this indicator was being updated with information for fiscal year (FY) 2022, Congress approved a $207 million appropriation for FY 2023. In current dollars, this is the largest amount ever appropriated for the agency and a $27 million increase over the previous year (Indicator IV-01a). Due to data limitations, a reliable estimate of the inflation-adjusted increase cannot yet be calculated.
- Inflation plays an important role in assessing funding for the agency over time. In FY 2022, the NEH received an appropriation of $180.0 million, the second largest ever given to the agency in nominal value. After taking inflation into account, however, the NEH’s FY 2022 appropriation, while the highest since 2011, was still lower than for the majority of the agency’s history.
- From FY 1968 through FY 1979, the agency experienced substantial, uninterrupted growth in its annual inflation-adjusted appropriation, which increased from $29.9 million to $472.2 million. In nominal terms, the appropriation continued to rise from 1979 to 1981, but it lost substantial value because of the high levels of inflation in those years. The nominal appropriation then experienced a 14% cut for FY 1982 (a 19% reduction in inflation-adjusted value). In most of the subsequent 13 years, the nominal value of the agency’s appropriation held steady or increased, but its inflation-adjusted value increased substantially less or declined. The appropriation was then cut by more than a third, with a decline in inflation-adjusted value from $295.7 in FY 1995 to $185.8 million in FY 1996.
- From FY 1997 through FY 2022, most years saw an increase in the nominal value of the agency’s appropriation, which brought it somewhat above its early 1990’s high point. In inflation-adjusted value, however, the agency’s FY 2022 funding level was 38% of its 1979 apex.
- Throughout the NEH’s history, the president’s budget request for the agency has tended to exceed the appropriation it receives (Indicator IV-01b). Notable exceptions occurred during the 1980s (particularly in the early years of the Reagan administration) and again from 2018 to 2021, when the Trump administration proposed shutting down the agency and requested only enough funding to cover closure-related costs.
- Indicator I-01c indicates the amount of funding received from the NEH by each state, the District of Columbia, and Puerto Rico in FY 2021. The total for each jurisdiction includes funding for new grants, supplemental grants, program contracts, and other program-related purposes. Grant monies include those distributed by formula1 to the state’s humanities council plus discretionary funding awards made to entities and individuals in that state. In FY 2021, each jurisdiction received funds from both the NEH’s base appropriation and the appropriation the agency received under the American Rescue Plan (ARP) legislation. For most jurisdictions, ARP funds constituted a substantial proportion of their funding for FY 2021: 42% on average.
- By a wide margin, New York received the most funding from the agency’s FY 2021 base appropriation ($16.3 million). California and Massachusetts received the next largest amounts, $8.5 and $7.0 respectively.
- When the number of people residing in a jurisdiction is taken into account, however, less populous jurisdictions rise to the top. The District of Columbia had the highest per capita funding level in FY 2021, $3.80 (in base appropriation only, as for all the amounts given in this paragraph). The District is unusual, however, in that some 40% of its total funding was for a $1.1 million contract with the National Museum of African American History and Culture. Hawaii and Wyoming had the next highest per capita funding, $1.50–$1.60. Alaska, Montana, and North Dakota were also among the top 10 jurisdictions for per capita funding from the NEH. The median FY 2021 per capita funding level by jurisdiction was 38 cents.
* This appropriation trend excludes supplemental COVID relief appropriations. The agency received $75 million in FY 2020 under the CARES Act. It received $135 for FY 2021 under the American Rescue Plan Act.
** Due to data limitations, 2022 is the most recent year for which an inflation adjustment is possible.
Source: Data acquired from NEH Appropriations History at https://www.neh.gov/neh-appropriations-history (accessed 1/26/2023). Funding amounts were adjusted for inflation using the Gross Domestic Purchases Price Index, a measure of inflation in the prices (including those for imported goods) paid by consumers, businesses, and governments in the United States. Quarterly estimates of the index, produced by the U.S. Department of Commerce’s Bureau of Economic Analysis, were obtained from the Federal Reserve Bank of St. Louis, https://fred.stlouisfed.org/series/B712RG3Q086SBEA (accessed 10/27/2022). Data presented by the American Academy of Arts and Sciences’ Humanities Indicators (www.humanitiesindicators.org).
* Due to data limitations, 2022 is the most recent year for which an inflation adjustment is possible.
Source: Data for years 1966 through 2007 were compiled by the National Humanities Alliance, at the request of the Humanities Indicators, from documentation supplied by the National Endowment for the Humanities’ (NEH) Office of Strategic Planning. Data for 2008 to 2015 were provided directly to the Humanities Indicators by NEH’s Office of Planning and Budget. Data for subsequent years up through 2022, with the exception of the amount of the budget request for 2021, were obtained from the documentation available at https://www.neh.gov/about/budget-performance (accessed 9/23/2022). The amount of the 2021 budget request was obtained from the press release at https://www.neh.gov/news/neh-statement-proposed-fy-2021-budget (accessed 9/23/2022) and the 2023 request from https://www.neh.gov/sites/default/files/inline-files/NEH%20FY%202023%20CJ.pdf (accessed 1/4/2023). The 2023 appropriation amount was obtained from https://www.appropriations.senate.gov/imo/media/doc/Interior%20FY%2023.pdf (accessed 1/4/2023).
Funding amounts were adjusted for inflation using the Gross Domestic Purchases Price Index, a measure of inflation in the prices paid (including those for imported goods) by consumers, businesses, and governments in the United States. Quarterly estimates of the Index, produced by the U.S. Department of Commerce's Bureau of Economic Analysis, were obtained from the Federal Reserve Bank of St. Louis, https://fred.stlouisfed.org/series/B712RG3Q086SBEA (accessed 10/27/2022).
Data presented by the American Academy of Arts and Sciences’ Humanities Indicators (www.humanitiesindicators.org).
IV-01c: National Endowment for the Humanities Funding* Distributed to States, the District of Columbia, and Puerto Rico, Total and Per Capita, Fiscal Year 2021 (Current Dollars)
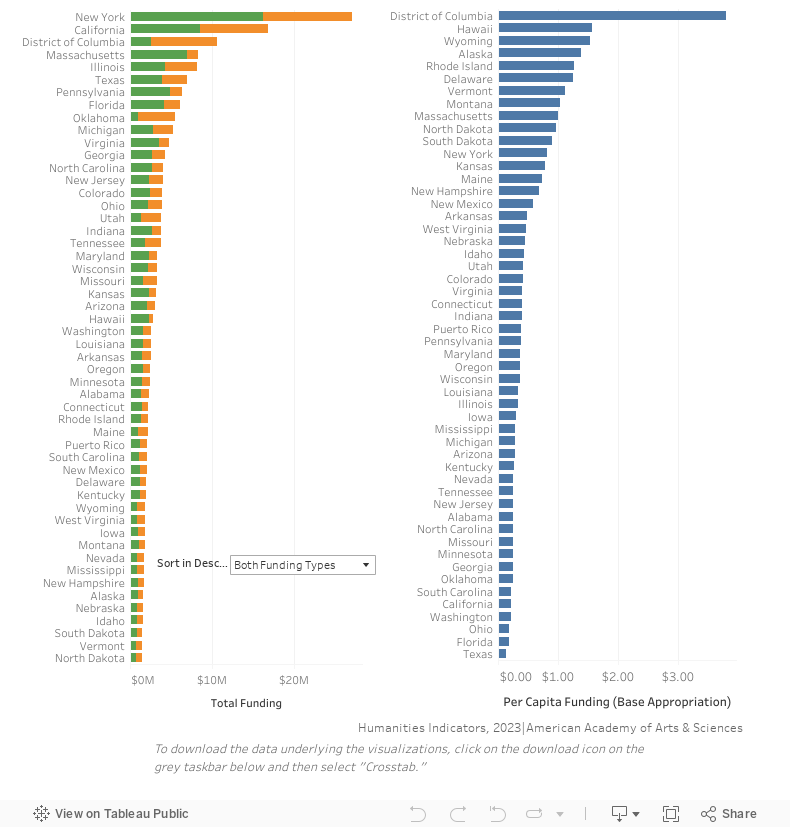
* Monies include those for new grants, supplemental grants, program contracts, and other program-related purposes. The amount for the District of Columbia includes, in addition to grants, funding for a $1.1 million contract with the National Museum of African American History and Culture.
Source: National Endowment for the Humanities (NEH), Office of Planning and Budget. The Humanities Indicators thanks NEH Budget Officer David Dohanic for his generous assistance. The population data used to calculate per capita amounts for states, the District of Columbia, and Puerto Rico were obtained from U.S. Census Bureau, Population Division, “Annual Estimates of the Resident Population for the United States, Regions, States, District of Columbia, and Puerto Rico: April 1, 2020 to July 1, 2021 (NST-EST2021-POP),” https://www2.census.gov/programs-surveys/popest/tables/2020-2021/state/totals/NST-EST2021-POP.xlsx (accessed 10/27/2022). Data presented by the American Academy of Arts and Sciences’ Humanities Indicators (www.humanitiesindicators.org).
The National Endowment for the Humanities (NEH) distributes grant dollars in two forms: 1) to state humanities councils according to a legislatively mandated formula (for a description of the formula by which monies are distributed among the councils and additional information on council funding, see “State Humanities Council Revenues”); and 2) as discretionary awards made to individuals and organizations, including state humanities councils, mainly through national grant competitions (information about funded projects is available via a searchable database on the agency’s website).
