Research and Development Expenditures at Colleges and Universities
In fiscal year (FY) 2023, expenditures for academic humanities R&D (excluding research in the discipline of communication) reached $846.9 million, the highest level observed going back to 2011 (Indicator IV-35a).1 Expenditures in 2023 were up 14% from the previous year and 108% from 2011 (with inflation taken into account).
Expenditures for academic humanities R&D were dwarfed by those for research in the STEM fields (science, technology, engineering, and medicine; Indicator IV-35b). At the extreme, expenditures for health sciences research in 2023 were over 42 times greater than funding for research in the humanities. Further, 2023 spending for humanities research equaled 0.8% of the amount dedicated to STEM R&D (when all scientific fields—including agricultural sciences and others not depicted in the graph—are considered).
The percentage growth in college and university spending for humanities research from 2011 to 2023 was substantially greater than that in any of the broad science fields examined here, such as the biological sciences (which experienced an increase of 27%) and engineering (38%). Comparisons between the humanities and STEM fields should be made with caution, however, given the humanities’ much smaller 2011 baseline value.
The percentage growth in spending for academic humanities R&D over the 2011–2023 period was markedly less than that for some other non-STEM fields, such as business/management (134%) and law (165%), but greater than that seen in education (40%).
Federal support constituted 8% of all academic humanities R&D expenditures in 2023 (Indicator IV-35c), which was similar to business and law but markedly smaller than the shares in education and each of the STEM fields (33%–67%).
From 2011 to 2023, every field examined here experienced a contraction in the federally funded share of R&D expenditures, but the phenomenon was much more pronounced in the humanities than in any of the STEM fields. Federal government funds constituted 20% of all humanities R&D expenditures in 2011. The share shrank in most of the subsequent years, reducing the federally funded share by over half. The 61% contraction in the federally funded share of humanities research far exceeded the 11% shrinkage seen in STEM.
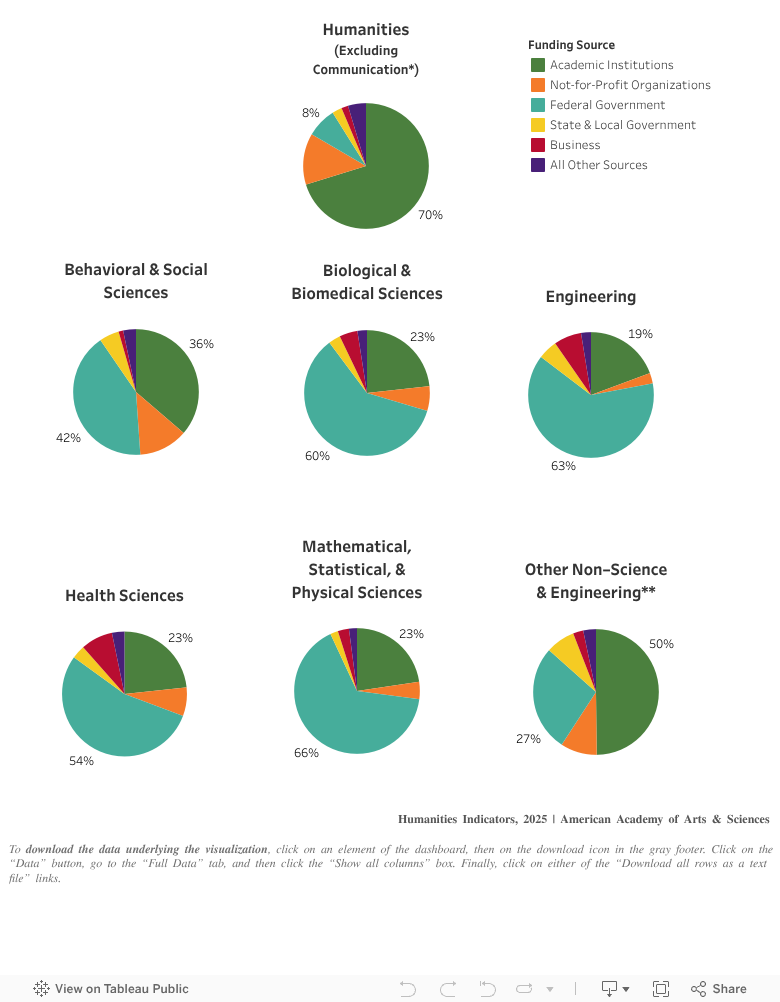
In comparison to research in other fields, academic humanities R&D in 2023 was much more likely to be funded by academic institutions themselves (Indicator IV-35d). While 70% of humanities R&D funding came from the academic institution where the research was being conducted, in every STEM field examined here no more than 36% of R&D was funded in this way.
* The system NSF uses to classify academic disciplines does not permit the separation of the more professionally oriented aspects of the communication discipline (e.g., broadcasting) from those that the Humanities Indicators treats as part of the humanities field (e.g., rhetoric and media studies). To avoid inflated estimates of humanities R&D expenditures, communication has been excluded from the humanities field for the purposes of this analysis. The analysis focuses on 2011–2023 as that is the period in which humanities expenditures were most fully captured by the survey on which this indicator is based; please see “About the Data” for details.
Source: National Center for Science and Engineering Statistics (NCSES), Higher Education Research and Development: Fiscal Year 2023, NSF 25-314 (National Science Foundation, 2024), available at https://ncses.nsf.gov/surveys/higher-education-research-development/2023 (accessed 7/15/2025). Data analyzed and presented by the American Academy of Arts and Sciences’ Humanities Indicators (http://www.humanitiesindicators.org/).
Inflation adjustment was made using the Gross Domestic Purchases deflators.
The National Science Foundation (NSF) has been surveying the nation’s colleges and universities about their expenditures for science and engineering research and development (R&D) since the early 1970s. As part of the fiscal year (FY) 2003 survey, NSF requested, for the first time, information on academic R&D in fields other than the sciences and engineering, including the humanities. The expenditures considered in the NSF survey are for both “sponsored research,” which is subsidized by outside entities (e.g., federal government agencies and private foundations), and “university research,” which is separately budgeted under an internal application of institutional funds (see the NSF survey questionnaire).
Prior to FY 2010, NSF did not attempt to estimate for nonresponse on the non-STEM research and development expenditure items included in the survey. Additionally, through FY 2010, the NSF R&D expenditure totals for the non-STEM fields were based on the spending of only those institutions that also performed science and engineering R&D. The expenditures of institutions that did not engage in science and engineering R&D but that may have conducted substantial amounts of research in humanities disciplines were not included. Beginning in FY 2011, NSF began including in its humanities R&D totals the expenditures of institutions that had spent at least $150,000 on R&D, irrespective of the fields in which such research was conducted.
These data underestimate the size of the national investment in college- and university-based humanities research because they do not capture two key forms of financial support for humanities faculty wishing to pursue research: (1) university-supported leave from teaching (e.g., sabbaticals); and (2) fellowship monies used by faculty to cover living expenses (when leave from teaching is without pay or at partial pay) and research-related costs (e.g., source materials and travel). Additionally, some universities that responded to the academic R&D survey reported only their science and engineering expenditures. For these reasons, the amounts reported here should be treated as lower-bound estimates of total investment in academic humanities research.
*The system NSF uses to classify academic disciplines does not permit the separation of the more professionally oriented aspects of the communication discipline (e.g., broadcasting) from those that the Humanities Indicators treats as part of the humanities field (e.g., rhetoric and media studies). To avoid inflated estimates of humanities R&D expenditures, communication has been excluded from the humanities field for the purposes of this analysis.
** Business management and business administration; communication and communication technologies; education; law; social work; and visual and performing arts.
Source: National Center for Science and Engineering Statistics (NCSES), Higher Education Research and Development: Fiscal Year 2023, NSF 25-314(National Science Foundation, 2024), available at https://ncses.nsf.gov/surveys/higher-education-research-development/2023 (accessed 7/15/2025). Data analyzed and presented by the American Academy of Arts and Sciences’ Humanities Indicators (http://www.humanitiesindicators.org/).
Inflation adjustment was made using the Gross Domestic Purchases deflators.
The National Science Foundation (NSF) has been surveying the nation’s colleges and universities about their expenditures for science and engineering research and development (R&D) since the early 1970s. As part of the fiscal year (FY) 2003 survey, NSF requested, for the first time, information on academic R&D in fields other than the sciences and engineering, including the humanities. The expenditures considered in the NSF survey are for both “sponsored research,” which is subsidized by outside entities (e.g., federal government agencies and private foundations), and “university research,” which is separately budgeted under an internal application of institutional funds (see the NSF survey questionnaire).
Prior to FY 2010, NSF did not attempt to estimate for nonresponse on the non-STEM research and development expenditure items included in the survey. Additionally, through FY 2010, the NSF R&D expenditure totals for the non-STEM fields were based on the spending of only those institutions that also performed science and engineering R&D. The expenditures of institutions that did not engage in science and engineering R&D but that may have conducted substantial amounts of research in humanities disciplines were not included. Beginning in FY 2011, NSF began including in its humanities R&D totals the expenditures of institutions that had spent at least $150,000 on R&D, irrespective of the fields in which such research was conducted.
These data underestimate the size of the national investment in college- and university-based humanities research because they do not capture two key forms of financial support for humanities faculty wishing to pursue research: (1) university-supported leave from teaching (e.g., sabbaticals); and (2) fellowship monies used by faculty to cover living expenses (when leave from teaching is without pay or at partial pay) and research-related costs (e.g., source materials and travel). Additionally, some universities that responded to the academic R&D survey reported only their science and engineering expenditures. For these reasons, the amounts reported here should be treated as lower-bound estimates of total investment in academic humanities research.
* The system NSF uses to classify academic disciplines does not permit the separation of the more professionally oriented aspects of the communication discipline (e.g., broadcasting) from those that the Humanities Indicators treats as part of the humanities field (e.g., rhetoric and media studies). To avoid inflated estimates of humanities R&D expenditures, communication has been excluded from the humanities field for the purposes of this analysis.
** Business management and business administration; communication and communication technologies; education; law; social work; and visual and performing arts.
Source: National Center for Science and Engineering Statistics (NCSES), Higher Education Research and Development: Fiscal Year 2023, NSF 25-314(National Science Foundation, 2024), available at https://ncses.nsf.gov/surveys/higher-education-research-development/2023 (accessed 7/15/2025). Data analyzed and presented by the American Academy of Arts and Sciences’ Humanities Indicators (http://www.humanitiesindicators.org/).
The National Science Foundation (NSF) has been surveying the nation’s colleges and universities about their expenditures for science and engineering research and development (R&D) since the early 1970s. As part of the fiscal year (FY) 2003 survey, NSF requested, for the first time, information on academic R&D in fields other than the sciences and engineering, including the humanities. The expenditures considered in the NSF survey are for both “sponsored research,” which is subsidized by outside entities (e.g., federal government agencies and private foundations), and “university research,” which is separately budgeted under an internal application of institutional funds (see the NSF survey questionnaire).
Prior to FY 2010, NSF did not attempt to estimate for nonresponse on the non-STEM research and development expenditure items included in the survey. Additionally, through FY 2010, the NSF R&D expenditure totals for the non-STEM fields were based on the spending of only those institutions that also performed science and engineering R&D. The expenditures of institutions that did not engage in science and engineering R&D but that may have conducted substantial amounts of research in humanities disciplines were not included. Beginning in FY 2011, NSF began including in its humanities R&D totals the expenditures of institutions that had spent at least $150,000 on R&D, irrespective of the fields in which such research was conducted.
These data underestimate the size of the national investment in college- and university-based humanities research because they do not capture two key forms of financial support for humanities faculty wishing to pursue research: (1) university-supported leave from teaching (e.g., sabbaticals); and (2) fellowship monies used by faculty to cover living expenses (when leave from teaching is without pay or at partial pay) and research-related costs (e.g., source materials and travel). Additionally, some universities that responded to the academic R&D survey reported only their science and engineering expenditures. For these reasons, the amounts reported here should be treated as lower-bound estimates of total investment in academic humanities research.
IV-35d: Sources of Funding for Academic Research and Development in the Humanities and Other Selected Fields, Fiscal Year 2023
* The system NSF uses to classify academic disciplines does not permit the separation of the more professionally oriented aspects of the communication discipline (e.g., broadcasting) from those that the Humanities Indicators treats as part of the humanities field (e.g., rhetoric and media studies). To avoid inflated estimates of humanities R&D expenditures, communication has been excluded from the humanities field for the purposes of this analysis.
** Business management and business administration; communication and communication technologies; education; law; social work; and visual and performing arts.
Source: National Center for Science and Engineering Statistics (NCSES), Higher Education Research and Development: Fiscal Year 2023, NSF 25-314(National Science Foundation, 2024), available at https://ncses.nsf.gov/surveys/higher-education-research-development/2023 (accessed 7/15/2025). Data analyzed and presented by the American Academy of Arts and Sciences’ Humanities Indicators (http://www.humanitiesindicators.org/).
The National Science Foundation (NSF) has been surveying the nation’s colleges and universities about their expenditures for science and engineering research and development (R&D) since the early 1970s. As part of the fiscal year (FY) 2003 survey, NSF requested, for the first time, information on academic R&D in fields other than the sciences and engineering, including the humanities. The expenditures considered in the NSF survey are for both “sponsored research,” which is subsidized by outside entities (e.g., federal government agencies and private foundations), and “university research,” which is separately budgeted under an internal application of institutional funds (see the NSF survey questionnaire).
Prior to FY 2010, NSF did not attempt to estimate for nonresponse on the non-STEM research and development expenditure items included in the survey. Additionally, through FY 2010, the NSF R&D expenditure totals for the non-STEM fields were based on the spending of only those institutions that also performed science and engineering R&D. The expenditures of institutions that did not engage in science and engineering R&D but that may have conducted substantial amounts of research in humanities disciplines were not included. Beginning in FY 2011, NSF began including in its humanities R&D totals the expenditures of institutions that had spent at least $150,000 on R&D, irrespective of the fields in which such research was conducted.
These data underestimate the size of the national investment in college- and university-based humanities research because they do not capture two key forms of financial support for humanities faculty wishing to pursue research: (1) university-supported leave from teaching (e.g., sabbaticals); and (2) fellowship monies used by faculty to cover living expenses (when leave from teaching is without pay or at partial pay) and research-related costs (e.g., source materials and travel). Additionally, some universities that responded to the academic R&D survey reported only their science and engineering expenditures. For these reasons, the amounts reported here should be treated as lower-bound estimates of total investment in academic humanities research.
